

Some say volatility, rather than debt, is the best way to think about risk as an investor, but Warren Buffett famously said that 'Volatility is far from synonymous with risk.' It's only natural to consider a company's balance sheet when you examine how risky it is, since debt is often involved when a business collapses. Importantly, Castrol India Limited (NSE:CASTROLIND) does carry debt. But should shareholders be worried about its use of debt?
When Is Debt Dangerous?
Debt and other liabilities become risky for a business when it cannot easily fulfill those obligations, either with free cash flow or by raising capital at an attractive price. In the worst case scenario, a company can go bankrupt if it cannot pay its creditors. However, a more frequent (but still costly) occurrence is where a company must issue shares at bargain-basement prices, permanently diluting shareholders, just to shore up its balance sheet. Of course, debt can be an important tool in businesses, particularly capital heavy businesses. When we think about a company's use of debt, we first look at cash and debt together.
Check out our latest analysis for Castrol India
What Is Castrol India's Debt?
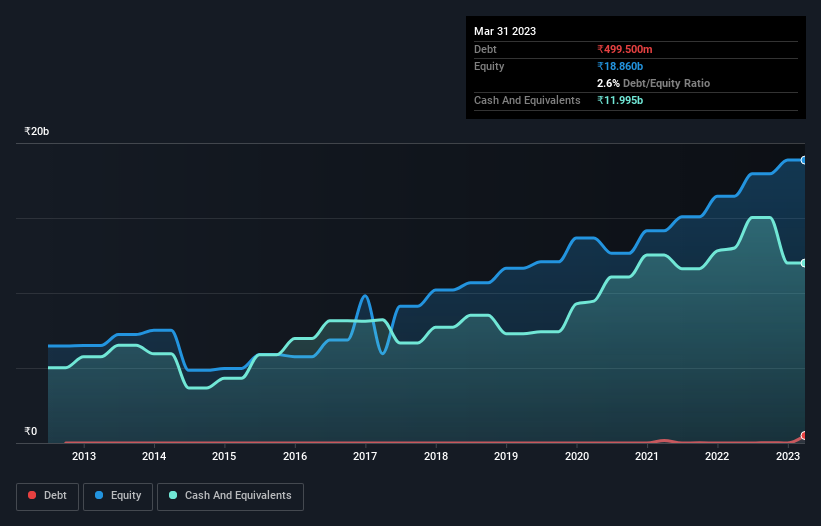
As you can see below, at the end of December 2022, Castrol India had ₹499.5m of debt, up from none a year ago. Click the image for more detail. But on the other hand it also has ₹12.0b in cash, leading to a ₹11.5b net cash position.
A Look At Castrol India's Liabilities
Zooming in on the latest balance sheet data, we can see that Castrol India had liabilities of ₹11.2b due within 12 months and liabilities of ₹638.7m due beyond that. Offsetting these obligations, it had cash of ₹12.0b as well as receivables valued at ₹3.76b due within 12 months. So it can boast ₹3.93b more liquid assets than total liabilities.
This short term liquidity is a sign that Castrol India could probably pay off its debt with ease, as its balance sheet is far from stretched. Simply put, the fact that Castrol India has more cash than debt is arguably a good indication that it can manage its debt safely.
Fortunately, Castrol India grew its EBIT by 7.4% in the last year, making that debt load look even more manageable. The balance sheet is clearly the area to focus on when you are analysing debt. But it is future earnings, more than anything, that will determine Castrol India's ability to maintain a healthy balance sheet going forward. So if you're focused on the future you can check out this free report showing analyst profit forecasts.
Finally, a company can only pay off debt with cold hard cash, not accounting profits. While Castrol India has net cash on its balance sheet, it's still worth taking a look at its ability to convert earnings before interest and tax (EBIT) to free cash flow, to help us understand how quickly it is building (or eroding) that cash balance. During the last three years, Castrol India produced sturdy free cash flow equating to 80% of its EBIT, about what we'd expect. This free cash flow puts the company in a good position to pay down debt, when appropriate.
Summing Up
While it is always sensible to investigate a company's debt, in this case Castrol India has ₹11.5b in net cash and a decent-looking balance sheet. The cherry on top was that in converted 80% of that EBIT to free cash flow, bringing in ₹8.1b. So is Castrol India's debt a risk? It doesn't seem so to us. Another positive for shareholders is that it pays dividends. So if you like receiving those dividend payments, check Castrol India's dividend history, without delay!
If, after all that, you're more interested in a fast growing company with a rock-solid balance sheet, then check out our list of net cash growth stocks without delay.
If you're looking to trade Castrol India, open an account with the lowest-cost platform trusted by professionals, Interactive Brokers.
With clients in over 200 countries and territories, and access to 160 markets, IBKR lets you trade stocks, options, futures, forex, bonds and funds from a single integrated account.
Enjoy no hidden fees, no account minimums, and FX conversion rates as low as 0.03%, far better than what most brokers offer.
Sponsored ContentNew: AI Stock Screener & Alerts
Our new AI Stock Screener scans the market every day to uncover opportunities.
• Dividend Powerhouses (3%+ Yield)
• Undervalued Small Caps with Insider Buying
• High growth Tech and AI Companies
Or build your own from over 50 metrics.
Have feedback on this article? Concerned about the content? Get in touch with us directly. Alternatively, email editorial-team (at) simplywallst.com.
This article by Simply Wall St is general in nature. We provide commentary based on historical data and analyst forecasts only using an unbiased methodology and our articles are not intended to be financial advice. It does not constitute a recommendation to buy or sell any stock, and does not take account of your objectives, or your financial situation. We aim to bring you long-term focused analysis driven by fundamental data. Note that our analysis may not factor in the latest price-sensitive company announcements or qualitative material. Simply Wall St has no position in any stocks mentioned.
About NSEI:CASTROLIND
Castrol India
Manufactures and markets automotive and industrial lubricants in India and internationally.
Solid track record with excellent balance sheet and pays a dividend.
Market Insights

Community Narratives

