
Advertisement
- India
- /
- Basic Materials
- /
- NSEI:BIRLACORPN
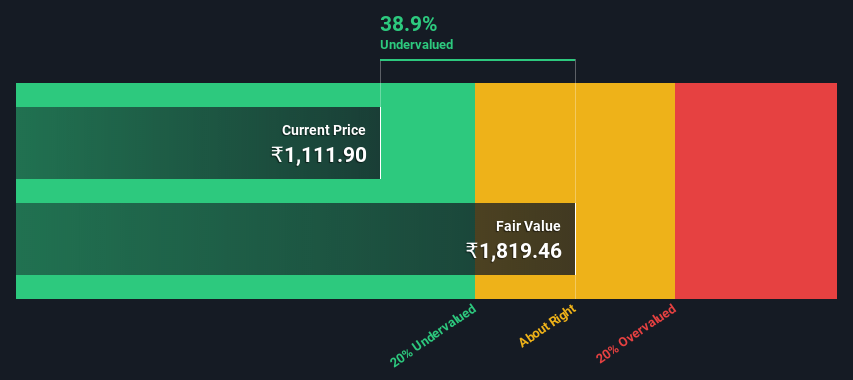
Birla Corporation Limited (NSE:BIRLACORPN) Shares Could Be 39% Below Their Intrinsic Value Estimate
In this article we are going to estimate the intrinsic value of Birla Corporation Limited (NSE:BIRLACORPN) by estimating the company's future cash flows and discounting them to their present value. One way to achieve this is by employing the Discounted Cash Flow (DCF) model. It may sound complicated, but actually it is quite simple!
We generally believe that a company's value is the present value of all of the cash it will generate in the future. However, a DCF is just one valuation metric among many, and it is not without flaws. If you want to learn more about discounted cash flow, the rationale behind this calculation can be read in detail in the Simply Wall St analysis model.
View our latest analysis for Birla
Is Birla fairly valued?
We're using the 2-stage growth model, which simply means we take in account two stages of company's growth. In the initial period the company may have a higher growth rate and the second stage is usually assumed to have a stable growth rate. In the first stage we need to estimate the cash flows to the business over the next ten years. Where possible we use analyst estimates, but when these aren't available we extrapolate the previous free cash flow (FCF) from the last estimate or reported value. We assume companies with shrinking free cash flow will slow their rate of shrinkage, and that companies with growing free cash flow will see their growth rate slow, over this period. We do this to reflect that growth tends to slow more in the early years than it does in later years.
Generally we assume that a dollar today is more valuable than a dollar in the future, so we need to discount the sum of these future cash flows to arrive at a present value estimate:
10-year free cash flow (FCF) forecast
| 2022 | 2023 | 2024 | 2025 | 2026 | 2027 | 2028 | 2029 | 2030 | 2031 | |
| Levered FCF (₹, Millions) | -₹119.7m | ₹7.84b | ₹9.53b | ₹10.5b | ₹11.4b | ₹12.4b | ₹13.3b | ₹14.3b | ₹15.4b | ₹16.5b |
| Growth Rate Estimate Source | Analyst x9 | Analyst x8 | Analyst x7 | Est @ 9.92% | Est @ 8.97% | Est @ 8.29% | Est @ 7.83% | Est @ 7.5% | Est @ 7.27% | Est @ 7.11% |
| Present Value (₹, Millions) Discounted @ 13% | -₹106 | ₹6.2k | ₹6.6k | ₹6.5k | ₹6.3k | ₹6.0k | ₹5.7k | ₹5.5k | ₹5.2k | ₹4.9k |
("Est" = FCF growth rate estimated by Simply Wall St)
Present Value of 10-year Cash Flow (PVCF) = ₹53b
The second stage is also known as Terminal Value, this is the business's cash flow after the first stage. The Gordon Growth formula is used to calculate Terminal Value at a future annual growth rate equal to the 5-year average of the 10-year government bond yield of 6.7%. We discount the terminal cash flows to today's value at a cost of equity of 13%.
Terminal Value (TV)= FCF2031 × (1 + g) ÷ (r – g) = ₹16b× (1 + 6.7%) ÷ (13%– 6.7%) = ₹291b
Present Value of Terminal Value (PVTV)= TV / (1 + r)10= ₹291b÷ ( 1 + 13%)10= ₹87b
The total value is the sum of cash flows for the next ten years plus the discounted terminal value, which results in the Total Equity Value, which in this case is ₹140b. In the final step we divide the equity value by the number of shares outstanding. Relative to the current share price of ₹1.1k, the company appears quite undervalued at a 39% discount to where the stock price trades currently. Remember though, that this is just an approximate valuation, and like any complex formula - garbage in, garbage out.
The assumptions
We would point out that the most important inputs to a discounted cash flow are the discount rate and of course the actual cash flows. If you don't agree with these result, have a go at the calculation yourself and play with the assumptions. The DCF also does not consider the possible cyclicality of an industry, or a company's future capital requirements, so it does not give a full picture of a company's potential performance. Given that we are looking at Birla as potential shareholders, the cost of equity is used as the discount rate, rather than the cost of capital (or weighted average cost of capital, WACC) which accounts for debt. In this calculation we've used 13%, which is based on a levered beta of 0.942. Beta is a measure of a stock's volatility, compared to the market as a whole. We get our beta from the industry average beta of globally comparable companies, with an imposed limit between 0.8 and 2.0, which is a reasonable range for a stable business.
Moving On:
Valuation is only one side of the coin in terms of building your investment thesis, and it shouldn't be the only metric you look at when researching a company. The DCF model is not a perfect stock valuation tool. Rather it should be seen as a guide to "what assumptions need to be true for this stock to be under/overvalued?" If a company grows at a different rate, or if its cost of equity or risk free rate changes sharply, the output can look very different. Can we work out why the company is trading at a discount to intrinsic value? For Birla, there are three fundamental items you should assess:
- Risks: For example, we've discovered 2 warning signs for Birla that you should be aware of before investing here.
- Management:Have insiders been ramping up their shares to take advantage of the market's sentiment for BIRLACORPN's future outlook? Check out our management and board analysis with insights on CEO compensation and governance factors.
- Other Solid Businesses: Low debt, high returns on equity and good past performance are fundamental to a strong business. Why not explore our interactive list of stocks with solid business fundamentals to see if there are other companies you may not have considered!
PS. Simply Wall St updates its DCF calculation for every Indian stock every day, so if you want to find the intrinsic value of any other stock just search here.
Valuation is complex, but we're here to simplify it.
Discover if Birla might be undervalued or overvalued with our detailed analysis, featuring fair value estimates, potential risks, dividends, insider trades, and its financial condition.
Access Free AnalysisHave feedback on this article? Concerned about the content? Get in touch with us directly. Alternatively, email editorial-team (at) simplywallst.com.
This article by Simply Wall St is general in nature. We provide commentary based on historical data and analyst forecasts only using an unbiased methodology and our articles are not intended to be financial advice. It does not constitute a recommendation to buy or sell any stock, and does not take account of your objectives, or your financial situation. We aim to bring you long-term focused analysis driven by fundamental data. Note that our analysis may not factor in the latest price-sensitive company announcements or qualitative material. Simply Wall St has no position in any stocks mentioned.
About NSEI:BIRLACORPN
Birla
Manufactures and sells cement and clinker in India and internationally.
Excellent balance sheet, good value and pays a dividend.
Similar Companies
Market Insights

Advertisement
Community Narratives
MINISO's fair value is projected at 26.69 with an anticipated PE ratio shift of 20x
Fair Value US$24.03|11.0% undervalued
BE
Community Contributor
Procter & Gamble: A Dividend Giant Facing Slowing Growth
Fair Value US$119.81|23.3% overvalued
AN
Community Contributor
Eli Lilly's Future Growth Driven by Tirzepatide and Favorable Market Conditions
Fair Value US$1.19k|13.8% undervalued
EA
Community Contributor