
Advertisement
Bhansali Engineering Polymers' (NSE:BEPL) five-year total shareholder returns outpace the underlying earnings growth
Bhansali Engineering Polymers Limited (NSE:BEPL) shareholders might be concerned after seeing the share price drop 18% in the last quarter. But that doesn't undermine the fantastic longer term performance (measured over five years). To be precise, the stock price is 551% higher than it was five years ago, a wonderful performance by any measure. So it might be that some shareholders are taking profits after good performance. The most important thing for savvy investors to consider is whether the underlying business can justify the share price gain. It really delights us to see such great share price performance for investors.
While this past week has detracted from the company's five-year return, let's look at the recent trends of the underlying business and see if the gains have been in alignment.
View our latest analysis for Bhansali Engineering Polymers
While markets are a powerful pricing mechanism, share prices reflect investor sentiment, not just underlying business performance. By comparing earnings per share (EPS) and share price changes over time, we can get a feel for how investor attitudes to a company have morphed over time.
Over half a decade, Bhansali Engineering Polymers managed to grow its earnings per share at 66% a year. This EPS growth is higher than the 45% average annual increase in the share price. Therefore, it seems the market has become relatively pessimistic about the company. This cautious sentiment is reflected in its (fairly low) P/E ratio of 5.80.
You can see below how EPS has changed over time (discover the exact values by clicking on the image).
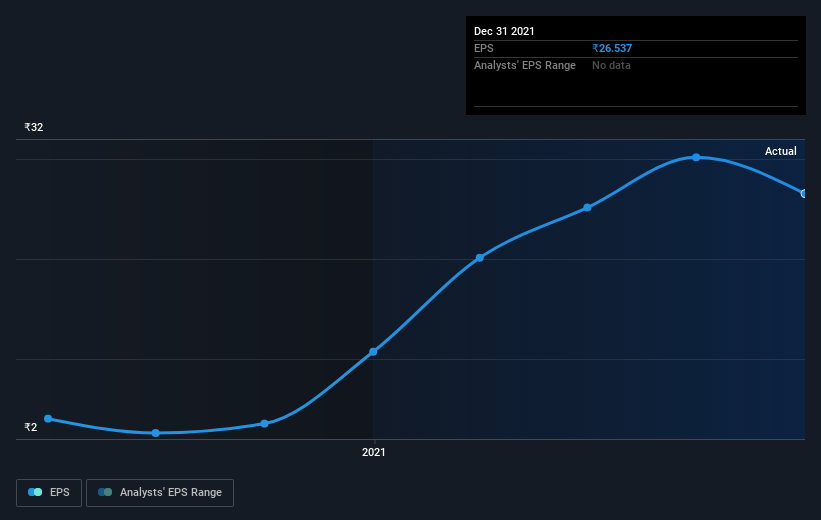
This free interactive report on Bhansali Engineering Polymers' earnings, revenue and cash flow is a great place to start, if you want to investigate the stock further.
What About Dividends?
It is important to consider the total shareholder return, as well as the share price return, for any given stock. The TSR is a return calculation that accounts for the value of cash dividends (assuming that any dividend received was reinvested) and the calculated value of any discounted capital raisings and spin-offs. So for companies that pay a generous dividend, the TSR is often a lot higher than the share price return. As it happens, Bhansali Engineering Polymers' TSR for the last 5 years was 572%, which exceeds the share price return mentioned earlier. And there's no prize for guessing that the dividend payments largely explain the divergence!
A Different Perspective
Bhansali Engineering Polymers shareholders gained a total return of 0.5% during the year. But that was short of the market average. If we look back over five years, the returns are even better, coming in at 46% per year for five years. Maybe the share price is just taking a breather while the business executes on its growth strategy. I find it very interesting to look at share price over the long term as a proxy for business performance. But to truly gain insight, we need to consider other information, too. Case in point: We've spotted 1 warning sign for Bhansali Engineering Polymers you should be aware of.
If you like to buy stocks alongside management, then you might just love this free list of companies. (Hint: insiders have been buying them).
Please note, the market returns quoted in this article reflect the market weighted average returns of stocks that currently trade on IN exchanges.
Valuation is complex, but we're here to simplify it.
Discover if Bhansali Engineering Polymers might be undervalued or overvalued with our detailed analysis, featuring fair value estimates, potential risks, dividends, insider trades, and its financial condition.
Access Free AnalysisHave feedback on this article? Concerned about the content? Get in touch with us directly. Alternatively, email editorial-team (at) simplywallst.com.
This article by Simply Wall St is general in nature. We provide commentary based on historical data and analyst forecasts only using an unbiased methodology and our articles are not intended to be financial advice. It does not constitute a recommendation to buy or sell any stock, and does not take account of your objectives, or your financial situation. We aim to bring you long-term focused analysis driven by fundamental data. Note that our analysis may not factor in the latest price-sensitive company announcements or qualitative material. Simply Wall St has no position in any stocks mentioned.
About NSEI:BEPL
Bhansali Engineering Polymers
Operates a petrochemical company in India and internationally.
Flawless balance sheet established dividend payer.
Similar Companies
Market Insights

Advertisement
Community Narratives
Quality at a Premium. A time to watch, not to buy?
Fair Value US$154.56|29.9% undervalued
DA
Community Contributor
GRAB: The Super-App at the Heart of Southeast Asia’s Digital Boom
Fair Value US$8.20|22.9% undervalued
BL
Community Contributor
Verve Group to Surge with 51.61% Revenue Growth
Fair Value €6.00|64.1% undervalued
ME
Community Contributor