
Advertisement
- India
- /
- Paper and Forestry Products
- /
- NSEI:AIROLAM
Airo Lam Limited's (NSE:AIROLAM) Stock On An Uptrend: Could Fundamentals Be Driving The Momentum?
Airo Lam (NSE:AIROLAM) has had a great run on the share market with its stock up by a significant 27% over the last three months. As most would know, fundamentals are what usually guide market price movements over the long-term, so we decided to look at the company's key financial indicators today to determine if they have any role to play in the recent price movement. Specifically, we decided to study Airo Lam's ROE in this article.
Return on equity or ROE is an important factor to be considered by a shareholder because it tells them how effectively their capital is being reinvested. Simply put, it is used to assess the profitability of a company in relation to its equity capital.
Check out our latest analysis for Airo Lam
How Is ROE Calculated?
The formula for return on equity is:
Return on Equity = Net Profit (from continuing operations) ÷ Shareholders' Equity
So, based on the above formula, the ROE for Airo Lam is:
13% = ₹86m ÷ ₹666m (Based on the trailing twelve months to December 2023).
The 'return' is the yearly profit. Another way to think of that is that for every ₹1 worth of equity, the company was able to earn ₹0.13 in profit.
What Is The Relationship Between ROE And Earnings Growth?
So far, we've learned that ROE is a measure of a company's profitability. We now need to evaluate how much profit the company reinvests or "retains" for future growth which then gives us an idea about the growth potential of the company. Generally speaking, other things being equal, firms with a high return on equity and profit retention, have a higher growth rate than firms that don’t share these attributes.
Airo Lam's Earnings Growth And 13% ROE
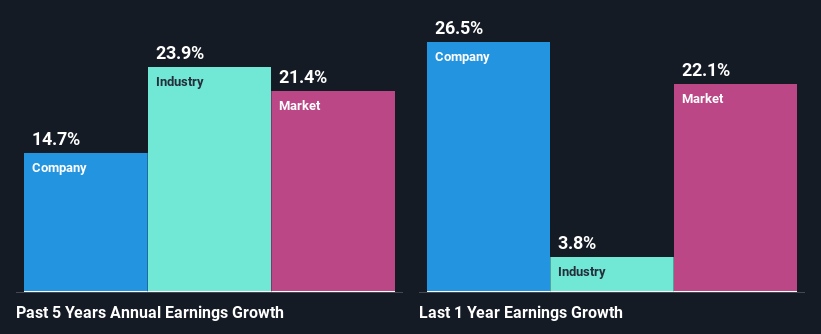
When you first look at it, Airo Lam's ROE doesn't look that attractive. However, the fact that the its ROE is quite higher to the industry average of 11% doesn't go unnoticed by us. This probably goes some way in explaining Airo Lam's moderate 15% growth over the past five years amongst other factors. Bear in mind, the company does have a moderately low ROE. It is just that the industry ROE is lower. So there might well be other reasons for the earnings to grow. Such as- high earnings retention or the company belonging to a high growth industry.
We then compared Airo Lam's net income growth with the industry and found that the company's growth figure is lower than the average industry growth rate of 24% in the same 5-year period, which is a bit concerning.
The basis for attaching value to a company is, to a great extent, tied to its earnings growth. It’s important for an investor to know whether the market has priced in the company's expected earnings growth (or decline). By doing so, they will have an idea if the stock is headed into clear blue waters or if swampy waters await. One good indicator of expected earnings growth is the P/E ratio which determines the price the market is willing to pay for a stock based on its earnings prospects. So, you may want to check if Airo Lam is trading on a high P/E or a low P/E, relative to its industry.
Is Airo Lam Efficiently Re-investing Its Profits?
Given that Airo Lam doesn't pay any dividend to its shareholders, we infer that the company has been reinvesting all of its profits to grow its business.
Summary
Overall, we feel that Airo Lam certainly does have some positive factors to consider. In particular, it's great to see that the company is investing heavily into its business and along with a moderate rate of return, that has resulted in a respectable growth in its earnings. While we won't completely dismiss the company, what we would do, is try to ascertain how risky the business is to make a more informed decision around the company. Our risks dashboard would have the 3 risks we have identified for Airo Lam.
New: Manage All Your Stock Portfolios in One Place
We've created the ultimate portfolio companion for stock investors, and it's free.
• Connect an unlimited number of Portfolios and see your total in one currency
• Be alerted to new Warning Signs or Risks via email or mobile
• Track the Fair Value of your stocks
Have feedback on this article? Concerned about the content? Get in touch with us directly. Alternatively, email editorial-team (at) simplywallst.com.
This article by Simply Wall St is general in nature. We provide commentary based on historical data and analyst forecasts only using an unbiased methodology and our articles are not intended to be financial advice. It does not constitute a recommendation to buy or sell any stock, and does not take account of your objectives, or your financial situation. We aim to bring you long-term focused analysis driven by fundamental data. Note that our analysis may not factor in the latest price-sensitive company announcements or qualitative material. Simply Wall St has no position in any stocks mentioned.
About NSEI:AIROLAM
Airo Lam
Engages in the production, processing, and marketing of decorative laminate sheets and plywood boards in India.
Slight risk with imperfect balance sheet.
Similar Companies
Market Insights

Advertisement
Community Narratives
The Next Phase of Energy Storage: How NeoVolta Is Tackling America’s Power Crunch
Fair Value US$7.50|35.1% undervalued
MA
Community Contributor
Why EnSilica is Worth Possibly 13x its Current Price
Fair Value UK£5.00|89.5% undervalued
DO
Community Contributor
M&A Activity, Industry Diversification & A Defense Contract Monopoly Will Push BWXT For Healthy Long-Term Growth
Fair Value US$220.00|15.2% undervalued
CL
Community Contributor
A case for Cassiar Gold Corp (TSXV: GLDC) to reach CAD$8-10 before 2030 (X30-37)
Fair Value CA$10.00|96.0% undervalued
AG
Community Contributor