Getting In Cheap On SBI Life Insurance Company Limited (NSE:SBILIFE) Is Unlikely


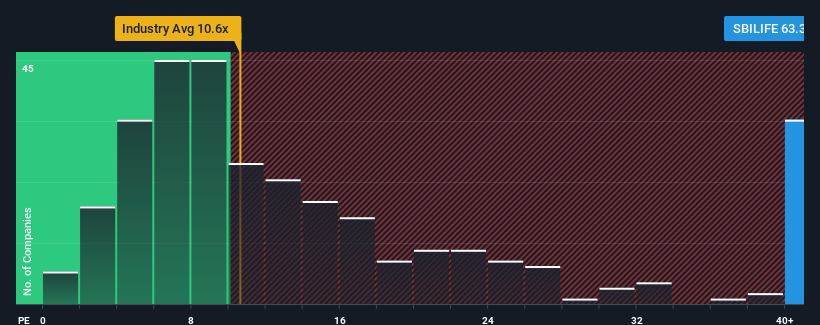
SBI Life Insurance Company Limited's (NSE:SBILIFE) price-to-earnings (or "P/E") ratio of 63.3x might make it look like a strong sell right now compared to the market in India, where around half of the companies have P/E ratios below 25x and even P/E's below 14x are quite common. Nonetheless, we'd need to dig a little deeper to determine if there is a rational basis for the highly elevated P/E.
We check all companies for important risks. See what we found for SBI Life Insurance in our free report.With earnings growth that's superior to most other companies of late, SBI Life Insurance has been doing relatively well. The P/E is probably high because investors think this strong earnings performance will continue. You'd really hope so, otherwise you're paying a pretty hefty price for no particular reason.
View our latest analysis for SBI Life Insurance
Is There Enough Growth For SBI Life Insurance?
SBI Life Insurance's P/E ratio would be typical for a company that's expected to deliver very strong growth, and importantly, perform much better than the market.
Retrospectively, the last year delivered an exceptional 29% gain to the company's bottom line. The latest three year period has also seen an excellent 76% overall rise in EPS, aided by its short-term performance. Accordingly, shareholders would have probably welcomed those medium-term rates of earnings growth.
Shifting to the future, estimates from the analysts covering the company suggest earnings should grow by 7.4% per annum over the next three years. Meanwhile, the rest of the market is forecast to expand by 19% each year, which is noticeably more attractive.
In light of this, it's alarming that SBI Life Insurance's P/E sits above the majority of other companies. It seems most investors are hoping for a turnaround in the company's business prospects, but the analyst cohort is not so confident this will happen. Only the boldest would assume these prices are sustainable as this level of earnings growth is likely to weigh heavily on the share price eventually.
The Key Takeaway
Typically, we'd caution against reading too much into price-to-earnings ratios when settling on investment decisions, though it can reveal plenty about what other market participants think about the company.
We've established that SBI Life Insurance currently trades on a much higher than expected P/E since its forecast growth is lower than the wider market. When we see a weak earnings outlook with slower than market growth, we suspect the share price is at risk of declining, sending the high P/E lower. This places shareholders' investments at significant risk and potential investors in danger of paying an excessive premium.
A lot of potential risks can sit within a company's balance sheet. Our free balance sheet analysis for SBI Life Insurance with six simple checks will allow you to discover any risks that could be an issue.
If you're unsure about the strength of SBI Life Insurance's business, why not explore our interactive list of stocks with solid business fundamentals for some other companies you may have missed.
If you're looking to trade SBI Life Insurance, open an account with the lowest-cost platform trusted by professionals, Interactive Brokers.
With clients in over 200 countries and territories, and access to 160 markets, IBKR lets you trade stocks, options, futures, forex, bonds and funds from a single integrated account.
Enjoy no hidden fees, no account minimums, and FX conversion rates as low as 0.03%, far better than what most brokers offer.
Sponsored ContentNew: Manage All Your Stock Portfolios in One Place
We've created the ultimate portfolio companion for stock investors, and it's free.
• Connect an unlimited number of Portfolios and see your total in one currency
• Be alerted to new Warning Signs or Risks via email or mobile
• Track the Fair Value of your stocks
Have feedback on this article? Concerned about the content? Get in touch with us directly. Alternatively, email editorial-team (at) simplywallst.com.
This article by Simply Wall St is general in nature. We provide commentary based on historical data and analyst forecasts only using an unbiased methodology and our articles are not intended to be financial advice. It does not constitute a recommendation to buy or sell any stock, and does not take account of your objectives, or your financial situation. We aim to bring you long-term focused analysis driven by fundamental data. Note that our analysis may not factor in the latest price-sensitive company announcements or qualitative material. Simply Wall St has no position in any stocks mentioned.
About NSEI:SBILIFE
SBI Life Insurance
Operates as a private life insurance company in India.
Solid track record with excellent balance sheet.
Similar Companies
Market Insights

Community Narratives

