- India
- /
- Personal Products
- /
- NSEI:CUPID
Cupid Limited's (NSE:CUPID) 33% Price Boost Is Out Of Tune With Revenues


Cupid Limited (NSE:CUPID) shares have continued their recent momentum with a 33% gain in the last month alone. The last 30 days were the cherry on top of the stock's 834% gain in the last year, which is nothing short of spectacular.
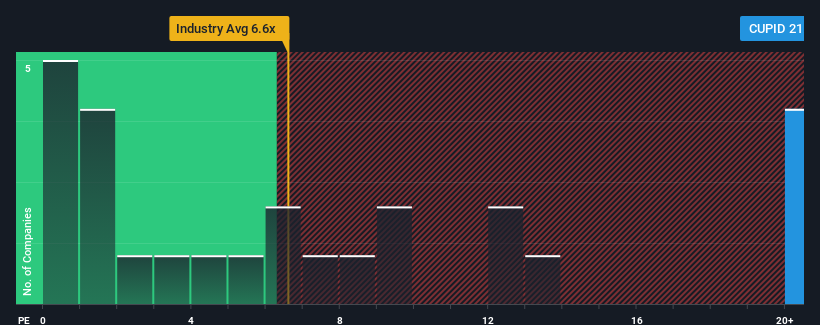
Since its price has surged higher, Cupid may be sending strong sell signals at present with a price-to-sales (or "P/S") ratio of 21.5x, when you consider almost half of the companies in the Personal Products industry in India have P/S ratios under 6.6x and even P/S lower than 1.6x aren't out of the ordinary. Nonetheless, we'd need to dig a little deeper to determine if there is a rational basis for the highly elevated P/S.
Check out our latest analysis for Cupid
What Does Cupid's Recent Performance Look Like?
For example, consider that Cupid's financial performance has been pretty ordinary lately as revenue growth is non-existent. One possibility is that the P/S is high because investors think the benign revenue growth will improve to outperform the broader industry in the near future. However, if this isn't the case, investors might get caught out paying too much for the stock.
Want the full picture on earnings, revenue and cash flow for the company? Then our free report on Cupid will help you shine a light on its historical performance.Do Revenue Forecasts Match The High P/S Ratio?
The only time you'd be truly comfortable seeing a P/S as steep as Cupid's is when the company's growth is on track to outshine the industry decidedly.
If we review the last year of revenue, the company posted a result that saw barely any deviation from a year ago. Likewise, not much has changed from three years ago as revenue have been stuck during that whole time. So it seems apparent to us that the company has struggled to grow revenue meaningfully over that time.
Comparing that to the industry, which is predicted to deliver 6.7% growth in the next 12 months, the company's momentum is weaker, based on recent medium-term annualised revenue results.
With this in mind, we find it worrying that Cupid's P/S exceeds that of its industry peers. It seems most investors are ignoring the fairly limited recent growth rates and are hoping for a turnaround in the company's business prospects. There's a good chance existing shareholders are setting themselves up for future disappointment if the P/S falls to levels more in line with recent growth rates.
What Does Cupid's P/S Mean For Investors?
Shares in Cupid have seen a strong upwards swing lately, which has really helped boost its P/S figure. Using the price-to-sales ratio alone to determine if you should sell your stock isn't sensible, however it can be a practical guide to the company's future prospects.
The fact that Cupid currently trades on a higher P/S relative to the industry is an oddity, since its recent three-year growth is lower than the wider industry forecast. When we see slower than industry revenue growth but an elevated P/S, there's considerable risk of the share price declining, sending the P/S lower. Unless the recent medium-term conditions improve markedly, it's very challenging to accept these the share price as being reasonable.
Many other vital risk factors can be found on the company's balance sheet. You can assess many of the main risks through our free balance sheet analysis for Cupid with six simple checks.
It's important to make sure you look for a great company, not just the first idea you come across. So if growing profitability aligns with your idea of a great company, take a peek at this free list of interesting companies with strong recent earnings growth (and a low P/E).
New: AI Stock Screener & Alerts
Our new AI Stock Screener scans the market every day to uncover opportunities.
• Dividend Powerhouses (3%+ Yield)
• Undervalued Small Caps with Insider Buying
• High growth Tech and AI Companies
Or build your own from over 50 metrics.
Have feedback on this article? Concerned about the content? Get in touch with us directly. Alternatively, email editorial-team (at) simplywallst.com.
This article by Simply Wall St is general in nature. We provide commentary based on historical data and analyst forecasts only using an unbiased methodology and our articles are not intended to be financial advice. It does not constitute a recommendation to buy or sell any stock, and does not take account of your objectives, or your financial situation. We aim to bring you long-term focused analysis driven by fundamental data. Note that our analysis may not factor in the latest price-sensitive company announcements or qualitative material. Simply Wall St has no position in any stocks mentioned.
About NSEI:CUPID
Cupid
Designs, manufactures, markets, and exports male and female condoms in India.
Flawless balance sheet with solid track record.
Similar Companies
Market Insights

Community Narratives

