- India
- /
- Healthcare Services
- /
- NSEI:ASTERDM
Aster DM Healthcare Limited (NSE:ASTERDM) Shares Could Be 39% Below Their Intrinsic Value Estimate


Key Insights
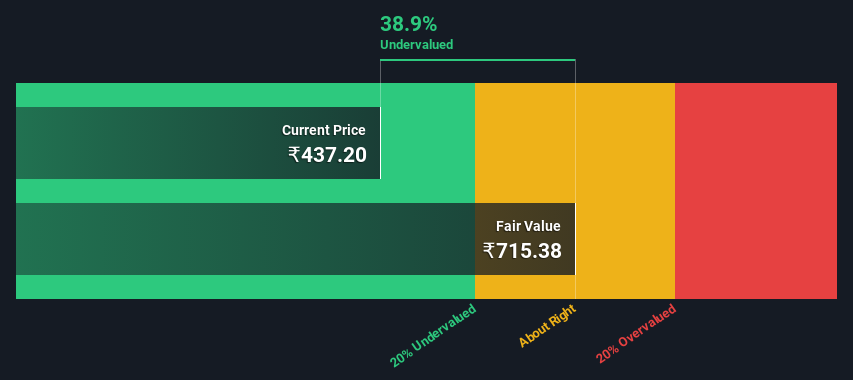
- Using the 2 Stage Free Cash Flow to Equity, Aster DM Healthcare fair value estimate is ₹715
- Aster DM Healthcare is estimated to be 39% undervalued based on current share price of ₹437
- Analyst price target for ASTERDM is ₹486 which is 32% below our fair value estimate
Does the March share price for Aster DM Healthcare Limited (NSE:ASTERDM) reflect what it's really worth? Today, we will estimate the stock's intrinsic value by projecting its future cash flows and then discounting them to today's value. We will use the Discounted Cash Flow (DCF) model on this occasion. Don't get put off by the jargon, the math behind it is actually quite straightforward.
We would caution that there are many ways of valuing a company and, like the DCF, each technique has advantages and disadvantages in certain scenarios. If you still have some burning questions about this type of valuation, take a look at the Simply Wall St analysis model.
See our latest analysis for Aster DM Healthcare
The Method
We are going to use a two-stage DCF model, which, as the name states, takes into account two stages of growth. The first stage is generally a higher growth period which levels off heading towards the terminal value, captured in the second 'steady growth' period. In the first stage we need to estimate the cash flows to the business over the next ten years. Where possible we use analyst estimates, but when these aren't available we extrapolate the previous free cash flow (FCF) from the last estimate or reported value. We assume companies with shrinking free cash flow will slow their rate of shrinkage, and that companies with growing free cash flow will see their growth rate slow, over this period. We do this to reflect that growth tends to slow more in the early years than it does in later years.
Generally we assume that a dollar today is more valuable than a dollar in the future, so we need to discount the sum of these future cash flows to arrive at a present value estimate:
10-year free cash flow (FCF) forecast
| 2024 | 2025 | 2026 | 2027 | 2028 | 2029 | 2030 | 2031 | 2032 | 2033 | |
| Levered FCF (₹, Millions) | ₹6.59b | ₹9.17b | ₹12.4b | ₹15.1b | ₹17.6b | ₹20.1b | ₹22.5b | ₹24.8b | ₹27.0b | ₹29.3b |
| Growth Rate Estimate Source | Analyst x3 | Analyst x3 | Analyst x3 | Est @ 21.39% | Est @ 16.99% | Est @ 13.91% | Est @ 11.75% | Est @ 10.24% | Est @ 9.18% | Est @ 8.44% |
| Present Value (₹, Millions) Discounted @ 11% | ₹5.9k | ₹7.5k | ₹9.1k | ₹9.9k | ₹10.5k | ₹10.8k | ₹10.8k | ₹10.8k | ₹10.6k | ₹10.4k |
("Est" = FCF growth rate estimated by Simply Wall St)
Present Value of 10-year Cash Flow (PVCF) = ₹96b
After calculating the present value of future cash flows in the initial 10-year period, we need to calculate the Terminal Value, which accounts for all future cash flows beyond the first stage. The Gordon Growth formula is used to calculate Terminal Value at a future annual growth rate equal to the 5-year average of the 10-year government bond yield of 6.7%. We discount the terminal cash flows to today's value at a cost of equity of 11%.
Terminal Value (TV)= FCF2033 × (1 + g) ÷ (r – g) = ₹29b× (1 + 6.7%) ÷ (11%– 6.7%) = ₹735b
Present Value of Terminal Value (PVTV)= TV / (1 + r)10= ₹735b÷ ( 1 + 11%)10= ₹260b
The total value, or equity value, is then the sum of the present value of the future cash flows, which in this case is ₹356b. To get the intrinsic value per share, we divide this by the total number of shares outstanding. Relative to the current share price of ₹437, the company appears quite undervalued at a 39% discount to where the stock price trades currently. The assumptions in any calculation have a big impact on the valuation, so it is better to view this as a rough estimate, not precise down to the last cent.
The Assumptions
The calculation above is very dependent on two assumptions. The first is the discount rate and the other is the cash flows. Part of investing is coming up with your own evaluation of a company's future performance, so try the calculation yourself and check your own assumptions. The DCF also does not consider the possible cyclicality of an industry, or a company's future capital requirements, so it does not give a full picture of a company's potential performance. Given that we are looking at Aster DM Healthcare as potential shareholders, the cost of equity is used as the discount rate, rather than the cost of capital (or weighted average cost of capital, WACC) which accounts for debt. In this calculation we've used 11%, which is based on a levered beta of 0.800. Beta is a measure of a stock's volatility, compared to the market as a whole. We get our beta from the industry average beta of globally comparable companies, with an imposed limit between 0.8 and 2.0, which is a reasonable range for a stable business.
SWOT Analysis for Aster DM Healthcare
- Debt is well covered by cash flow.
- Earnings declined over the past year.
- Interest payments on debt are not well covered.
- Annual earnings are forecast to grow faster than the Indian market.
- Good value based on P/E ratio and estimated fair value.
- Revenue is forecast to grow slower than 20% per year.
Moving On:
Whilst important, the DCF calculation is only one of many factors that you need to assess for a company. DCF models are not the be-all and end-all of investment valuation. Instead the best use for a DCF model is to test certain assumptions and theories to see if they would lead to the company being undervalued or overvalued. For instance, if the terminal value growth rate is adjusted slightly, it can dramatically alter the overall result. What is the reason for the share price sitting below the intrinsic value? For Aster DM Healthcare, we've compiled three additional factors you should look at:
- Risks: Every company has them, and we've spotted 2 warning signs for Aster DM Healthcare (of which 1 is potentially serious!) you should know about.
- Future Earnings: How does ASTERDM's growth rate compare to its peers and the wider market? Dig deeper into the analyst consensus number for the upcoming years by interacting with our free analyst growth expectation chart.
- Other High Quality Alternatives: Do you like a good all-rounder? Explore our interactive list of high quality stocks to get an idea of what else is out there you may be missing!
PS. The Simply Wall St app conducts a discounted cash flow valuation for every stock on the NSEI every day. If you want to find the calculation for other stocks just search here.
If you're looking to trade Aster DM Healthcare, open an account with the lowest-cost platform trusted by professionals, Interactive Brokers.
With clients in over 200 countries and territories, and access to 160 markets, IBKR lets you trade stocks, options, futures, forex, bonds and funds from a single integrated account.
Enjoy no hidden fees, no account minimums, and FX conversion rates as low as 0.03%, far better than what most brokers offer.
Sponsored ContentNew: Manage All Your Stock Portfolios in One Place
We've created the ultimate portfolio companion for stock investors, and it's free.
• Connect an unlimited number of Portfolios and see your total in one currency
• Be alerted to new Warning Signs or Risks via email or mobile
• Track the Fair Value of your stocks
Have feedback on this article? Concerned about the content? Get in touch with us directly. Alternatively, email editorial-team (at) simplywallst.com.
This article by Simply Wall St is general in nature. We provide commentary based on historical data and analyst forecasts only using an unbiased methodology and our articles are not intended to be financial advice. It does not constitute a recommendation to buy or sell any stock, and does not take account of your objectives, or your financial situation. We aim to bring you long-term focused analysis driven by fundamental data. Note that our analysis may not factor in the latest price-sensitive company announcements or qualitative material. Simply Wall St has no position in any stocks mentioned.
About NSEI:ASTERDM
Aster DM Healthcare
Provides healthcare and allied services in India, the United Arab Emirates, Qatar, Oman, Kingdom of Saudi Arabia, Jordan, Kuwait and Bahrain, and Republic of Mauritius.
Excellent balance sheet with reasonable growth potential.
Market Insights

Community Narratives

