
Advertisement
Vadilal Industries' (NSE:VADILALIND) 68% CAGR outpaced the company's earnings growth over the same three-year period

We think that it's fair to say that the possibility of finding fantastic multi-year winners is what motivates many investors. Mistakes are inevitable, but a single top stock pick can cover any losses, and so much more. One bright shining star stock has been Vadilal Industries Limited (NSE:VADILALIND), which is 376% higher than three years ago. It's also up 44% in about a month. This could be related to the recent financial results that were recently released - you could check the most recent data by reading our company report.
Since it's been a strong week for Vadilal Industries shareholders, let's have a look at trend of the longer term fundamentals.
View our latest analysis for Vadilal Industries
To quote Buffett, 'Ships will sail around the world but the Flat Earth Society will flourish. There will continue to be wide discrepancies between price and value in the marketplace...' One flawed but reasonable way to assess how sentiment around a company has changed is to compare the earnings per share (EPS) with the share price.
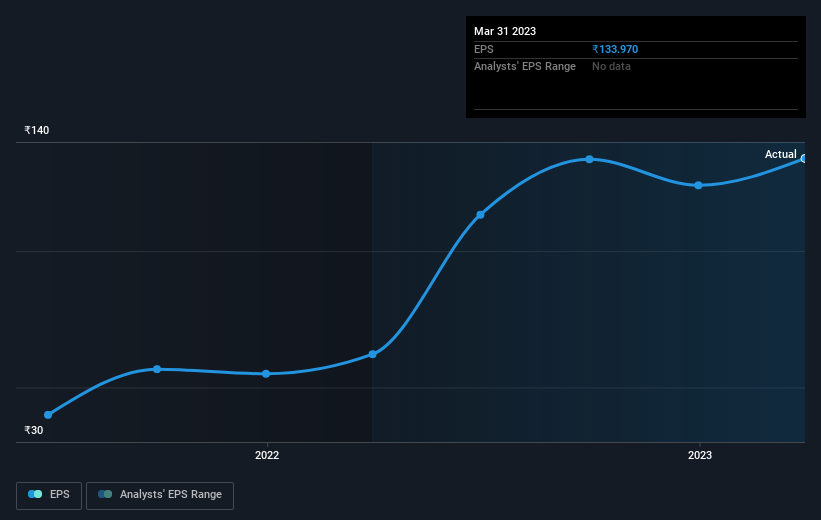
During three years of share price growth, Vadilal Industries achieved compound earnings per share growth of 33% per year. This EPS growth is lower than the 68% average annual increase in the share price. This indicates that the market is feeling more optimistic on the stock, after the last few years of progress. It is quite common to see investors become enamoured with a business, after a few years of solid progress.
The graphic below depicts how EPS has changed over time (unveil the exact values by clicking on the image).
We're pleased to report that the CEO is remunerated more modestly than most CEOs at similarly capitalized companies. It's always worth keeping an eye on CEO pay, but a more important question is whether the company will grow earnings throughout the years. Dive deeper into the earnings by checking this interactive graph of Vadilal Industries' earnings, revenue and cash flow.
A Different Perspective
We're pleased to report that Vadilal Industries shareholders have received a total shareholder return of 48% over one year. And that does include the dividend. That gain is better than the annual TSR over five years, which is 31%. Therefore it seems like sentiment around the company has been positive lately. Someone with an optimistic perspective could view the recent improvement in TSR as indicating that the business itself is getting better with time. While it is well worth considering the different impacts that market conditions can have on the share price, there are other factors that are even more important. Case in point: We've spotted 3 warning signs for Vadilal Industries you should be aware of, and 2 of them shouldn't be ignored.
For those who like to find winning investments this free list of growing companies with recent insider purchasing, could be just the ticket.
Please note, the market returns quoted in this article reflect the market weighted average returns of stocks that currently trade on Indian exchanges.
New: Manage All Your Stock Portfolios in One Place
We've created the ultimate portfolio companion for stock investors, and it's free.
• Connect an unlimited number of Portfolios and see your total in one currency
• Be alerted to new Warning Signs or Risks via email or mobile
• Track the Fair Value of your stocks
Have feedback on this article? Concerned about the content? Get in touch with us directly. Alternatively, email editorial-team (at) simplywallst.com.
This article by Simply Wall St is general in nature. We provide commentary based on historical data and analyst forecasts only using an unbiased methodology and our articles are not intended to be financial advice. It does not constitute a recommendation to buy or sell any stock, and does not take account of your objectives, or your financial situation. We aim to bring you long-term focused analysis driven by fundamental data. Note that our analysis may not factor in the latest price-sensitive company announcements or qualitative material. Simply Wall St has no position in any stocks mentioned.
About NSEI:VADILALIND
Vadilal Industries
Manufactures and sells ice-cream in India and internationally.
Flawless balance sheet with acceptable track record.
Market Insights

Advertisement
Community Narratives
Groundbreaking therapies that could change the treatment landscape for PTSD, fibromyalgia, MS & Alzheimer’s
Fair Value US$6.20|86.9% undervalued
CM
Community Contributor
DigitalOcean Will Grow 14% by Embracing AI with Paperspace Acquisition
Fair Value US$50.00|41.7% undervalued
NE
Community Contributor
Viant Technology: A Rising AdTech Challenger in the AI-Powered CTV Market
Fair Value US$38.61|63.2% undervalued
BL
Community Contributor
Volvo will Accelerate Forward into Electric and Autonomous Leadership in Five Years
Fair Value SEK 438.80|39.7% undervalued
UN
Community Contributor