Triveni Engineering & Industries' (NSE:TRIVENI) earnings growth rate lags the 43% CAGR delivered to shareholders


For many, the main point of investing in the stock market is to achieve spectacular returns. While the best companies are hard to find, but they can generate massive returns over long periods. For example, the Triveni Engineering & Industries Limited (NSE:TRIVENI) share price is up a whopping 463% in the last half decade, a handsome return for long term holders. If that doesn't get you thinking about long term investing, we don't know what will. On the other hand, the stock price has retraced 5.4% in the last week. But note that the broader market is down 0.3% since last week, and this may have impacted Triveni Engineering & Industries' share price.
Although Triveni Engineering & Industries has shed ₹4.1b from its market cap this week, let's take a look at its longer term fundamental trends and see if they've driven returns.
See our latest analysis for Triveni Engineering & Industries
While markets are a powerful pricing mechanism, share prices reflect investor sentiment, not just underlying business performance. One flawed but reasonable way to assess how sentiment around a company has changed is to compare the earnings per share (EPS) with the share price.
During five years of share price growth, Triveni Engineering & Industries achieved compound earnings per share (EPS) growth of 71% per year. This EPS growth is higher than the 41% average annual increase in the share price. So one could conclude that the broader market has become more cautious towards the stock.
The graphic below depicts how EPS has changed over time (unveil the exact values by clicking on the image).
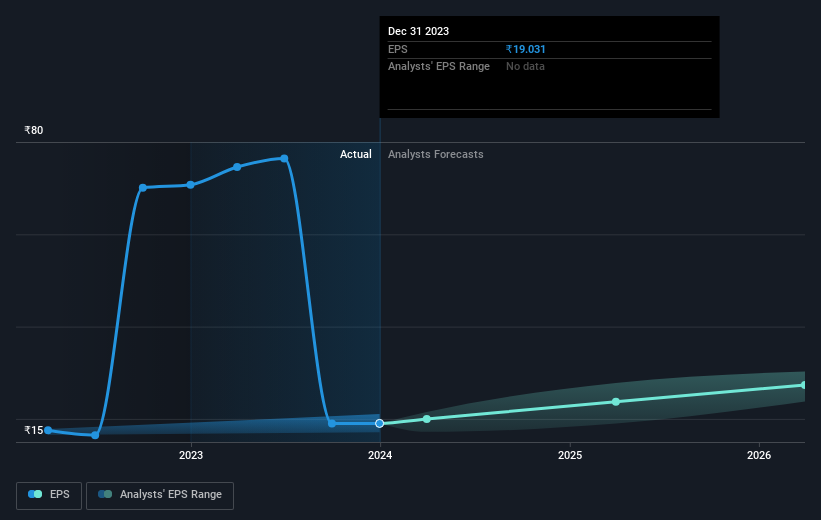
Dive deeper into Triveni Engineering & Industries' key metrics by checking this interactive graph of Triveni Engineering & Industries's earnings, revenue and cash flow.
What About Dividends?
As well as measuring the share price return, investors should also consider the total shareholder return (TSR). The TSR is a return calculation that accounts for the value of cash dividends (assuming that any dividend received was reinvested) and the calculated value of any discounted capital raisings and spin-offs. It's fair to say that the TSR gives a more complete picture for stocks that pay a dividend. In the case of Triveni Engineering & Industries, it has a TSR of 500% for the last 5 years. That exceeds its share price return that we previously mentioned. And there's no prize for guessing that the dividend payments largely explain the divergence!
A Different Perspective
Triveni Engineering & Industries shareholders gained a total return of 22% during the year. But that was short of the market average. It's probably a good sign that the company has an even better long term track record, having provided shareholders with an annual TSR of 43% over five years. It's quite possible the business continues to execute with prowess, even as the share price gains are slowing. I find it very interesting to look at share price over the long term as a proxy for business performance. But to truly gain insight, we need to consider other information, too. Consider risks, for instance. Every company has them, and we've spotted 2 warning signs for Triveni Engineering & Industries you should know about.
Of course Triveni Engineering & Industries may not be the best stock to buy. So you may wish to see this free collection of growth stocks.
Please note, the market returns quoted in this article reflect the market weighted average returns of stocks that currently trade on Indian exchanges.
Valuation is complex, but we're here to simplify it.
Discover if Triveni Engineering & Industries might be undervalued or overvalued with our detailed analysis, featuring fair value estimates, potential risks, dividends, insider trades, and its financial condition.
Access Free AnalysisHave feedback on this article? Concerned about the content? Get in touch with us directly. Alternatively, email editorial-team (at) simplywallst.com.
This article by Simply Wall St is general in nature. We provide commentary based on historical data and analyst forecasts only using an unbiased methodology and our articles are not intended to be financial advice. It does not constitute a recommendation to buy or sell any stock, and does not take account of your objectives, or your financial situation. We aim to bring you long-term focused analysis driven by fundamental data. Note that our analysis may not factor in the latest price-sensitive company announcements or qualitative material. Simply Wall St has no position in any stocks mentioned.
About NSEI:TRIVENI
Triveni Engineering & Industries
Engages in the sugar and allied businesses, and engineering businesses in India and internationally.
Flawless balance sheet with moderate growth potential.
Similar Companies
Market Insights

Community Narratives

