
Advertisement
Rossell India (NSE:ROSSELLIND) Is Doing The Right Things To Multiply Its Share Price

If you're looking for a multi-bagger, there's a few things to keep an eye out for. In a perfect world, we'd like to see a company investing more capital into its business and ideally the returns earned from that capital are also increasing. If you see this, it typically means it's a company with a great business model and plenty of profitable reinvestment opportunities. With that in mind, we've noticed some promising trends at Rossell India (NSE:ROSSELLIND) so let's look a bit deeper.
Understanding Return On Capital Employed (ROCE)
Just to clarify if you're unsure, ROCE is a metric for evaluating how much pre-tax income (in percentage terms) a company earns on the capital invested in its business. Analysts use this formula to calculate it for Rossell India:
Return on Capital Employed = Earnings Before Interest and Tax (EBIT) ÷ (Total Assets - Current Liabilities)
0.11 = ₹341m ÷ (₹5.1b - ₹2.1b) (Based on the trailing twelve months to June 2023).
Therefore, Rossell India has an ROCE of 11%. In absolute terms, that's a pretty normal return, and it's somewhat close to the Food industry average of 13%.
View our latest analysis for Rossell India
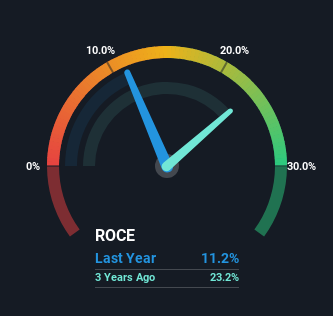
Historical performance is a great place to start when researching a stock so above you can see the gauge for Rossell India's ROCE against it's prior returns. If you're interested in investigating Rossell India's past further, check out this free graph of past earnings, revenue and cash flow.
So How Is Rossell India's ROCE Trending?
We like the trends that we're seeing from Rossell India. The data shows that returns on capital have increased substantially over the last five years to 11%. Basically the business is earning more per dollar of capital invested and in addition to that, 71% more capital is being employed now too. This can indicate that there's plenty of opportunities to invest capital internally and at ever higher rates, a combination that's common among multi-baggers.
Another thing to note, Rossell India has a high ratio of current liabilities to total assets of 41%. This effectively means that suppliers (or short-term creditors) are funding a large portion of the business, so just be aware that this can introduce some elements of risk. Ideally we'd like to see this reduce as that would mean fewer obligations bearing risks.
The Bottom Line On Rossell India's ROCE
All in all, it's terrific to see that Rossell India is reaping the rewards from prior investments and is growing its capital base. And a remarkable 506% total return over the last five years tells us that investors are expecting more good things to come in the future. With that being said, we still think the promising fundamentals mean the company deserves some further due diligence.
If you want to know some of the risks facing Rossell India we've found 3 warning signs (1 is a bit unpleasant!) that you should be aware of before investing here.
For those who like to invest in solid companies, check out this free list of companies with solid balance sheets and high returns on equity.
New: AI Stock Screener & Alerts
Our new AI Stock Screener scans the market every day to uncover opportunities.
• Dividend Powerhouses (3%+ Yield)
• Undervalued Small Caps with Insider Buying
• High growth Tech and AI Companies
Or build your own from over 50 metrics.
Have feedback on this article? Concerned about the content? Get in touch with us directly. Alternatively, email editorial-team (at) simplywallst.com.
This article by Simply Wall St is general in nature. We provide commentary based on historical data and analyst forecasts only using an unbiased methodology and our articles are not intended to be financial advice. It does not constitute a recommendation to buy or sell any stock, and does not take account of your objectives, or your financial situation. We aim to bring you long-term focused analysis driven by fundamental data. Note that our analysis may not factor in the latest price-sensitive company announcements or qualitative material. Simply Wall St has no position in any stocks mentioned.
About NSEI:ROSSELLIND
Flawless balance sheet with proven track record.
Similar Companies
Market Insights


Advertisement
Community Narratives
Suncorp’s Next Chapter: Insurance-Only and Ready to Grow
Fair Value AU$22.83|5.7% undervalued
RO
Community Contributor
Thyssenkrupp Nucera Will Achieve Double-Digit Profits by 2030 Boosted by Hydrogen Growth
Fair Value €14.40|31.6% undervalued
CH
Community Contributor
Tesla’s Nvidia Moment – The AI & Robotics Inflection Point
Fair Value US$384.84|21.9% undervalued
BL
Community Contributor