Is Weakness In M. K. Proteins Limited (NSE:MKPL) Stock A Sign That The Market Could be Wrong Given Its Strong Financial Prospects?


It is hard to get excited after looking at M. K. Proteins' (NSE:MKPL) recent performance, when its stock has declined 57% over the past three months. But if you pay close attention, you might gather that its strong financials could mean that the stock could potentially see an increase in value in the long-term, given how markets usually reward companies with good financial health. In this article, we decided to focus on M. K. Proteins' ROE.
ROE or return on equity is a useful tool to assess how effectively a company can generate returns on the investment it received from its shareholders. In simpler terms, it measures the profitability of a company in relation to shareholder's equity.
See our latest analysis for M. K. Proteins
How Do You Calculate Return On Equity?
The formula for ROE is:
Return on Equity = Net Profit (from continuing operations) ÷ Shareholders' Equity
So, based on the above formula, the ROE for M. K. Proteins is:
18% = ₹98m ÷ ₹532m (Based on the trailing twelve months to September 2023).
The 'return' is the yearly profit. Another way to think of that is that for every ₹1 worth of equity, the company was able to earn ₹0.18 in profit.
Why Is ROE Important For Earnings Growth?
Thus far, we have learned that ROE measures how efficiently a company is generating its profits. We now need to evaluate how much profit the company reinvests or "retains" for future growth which then gives us an idea about the growth potential of the company. Assuming everything else remains unchanged, the higher the ROE and profit retention, the higher the growth rate of a company compared to companies that don't necessarily bear these characteristics.
M. K. Proteins' Earnings Growth And 18% ROE
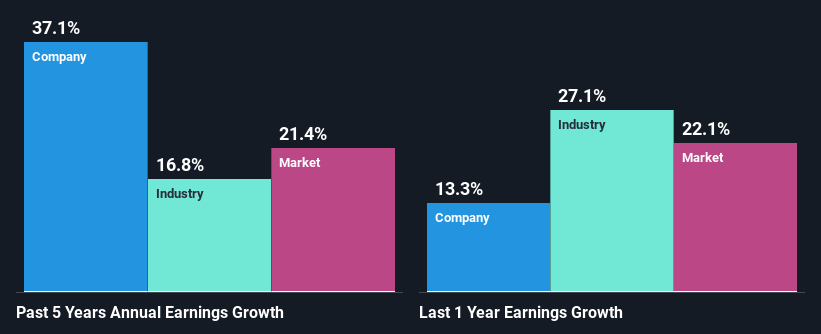
To start with, M. K. Proteins' ROE looks acceptable. On comparing with the average industry ROE of 12% the company's ROE looks pretty remarkable. This probably laid the ground for M. K. Proteins' significant 37% net income growth seen over the past five years. However, there could also be other causes behind this growth. For instance, the company has a low payout ratio or is being managed efficiently.
As a next step, we compared M. K. Proteins' net income growth with the industry, and pleasingly, we found that the growth seen by the company is higher than the average industry growth of 17%.
Earnings growth is a huge factor in stock valuation. What investors need to determine next is if the expected earnings growth, or the lack of it, is already built into the share price. This then helps them determine if the stock is placed for a bright or bleak future. Is M. K. Proteins fairly valued compared to other companies? These 3 valuation measures might help you decide.
Is M. K. Proteins Efficiently Re-investing Its Profits?
M. K. Proteins doesn't pay any dividend to its shareholders, meaning that the company has been reinvesting all of its profits into the business. This is likely what's driving the high earnings growth number discussed above.
Conclusion
On the whole, we feel that M. K. Proteins' performance has been quite good. In particular, it's great to see that the company is investing heavily into its business and along with a high rate of return, that has resulted in a sizeable growth in its earnings. If the company continues to grow its earnings the way it has, that could have a positive impact on its share price given how earnings per share influence long-term share prices. Not to forget, share price outcomes are also dependent on the potential risks a company may face. So it is important for investors to be aware of the risks involved in the business. Our risks dashboard would have the 2 risks we have identified for M. K. Proteins.
New: Manage All Your Stock Portfolios in One Place
We've created the ultimate portfolio companion for stock investors, and it's free.
• Connect an unlimited number of Portfolios and see your total in one currency
• Be alerted to new Warning Signs or Risks via email or mobile
• Track the Fair Value of your stocks
Have feedback on this article? Concerned about the content? Get in touch with us directly. Alternatively, email editorial-team (at) simplywallst.com.
This article by Simply Wall St is general in nature. We provide commentary based on historical data and analyst forecasts only using an unbiased methodology and our articles are not intended to be financial advice. It does not constitute a recommendation to buy or sell any stock, and does not take account of your objectives, or your financial situation. We aim to bring you long-term focused analysis driven by fundamental data. Note that our analysis may not factor in the latest price-sensitive company announcements or qualitative material. Simply Wall St has no position in any stocks mentioned.
About NSEI:MKPL
M. K. Proteins
Manufactures and trades in vegetable refined oil and by-products.
Flawless balance sheet with solid track record.
Similar Companies
Market Insights

Community Narratives

