Globus Spirits (NSE:GLOBUSSPR) jumps 10% this week, though earnings growth is still tracking behind five-year shareholder returns


It hasn't been the best quarter for Globus Spirits Limited (NSE:GLOBUSSPR) shareholders, since the share price has fallen 13% in that time. But that doesn't change the fact that the returns over the last half decade have been spectacular. To be precise, the stock price is 435% higher than it was five years ago, a wonderful performance by any measure. Arguably, the recent fall is to be expected after such a strong rise. Of course what matters most is whether the business can improve itself sustainably, thus justifying a higher price.
Since the stock has added ₹2.0b to its market cap in the past week alone, let's see if underlying performance has been driving long-term returns.
View our latest analysis for Globus Spirits
While the efficient markets hypothesis continues to be taught by some, it has been proven that markets are over-reactive dynamic systems, and investors are not always rational. One way to examine how market sentiment has changed over time is to look at the interaction between a company's share price and its earnings per share (EPS).
Over half a decade, Globus Spirits managed to grow its earnings per share at 40% a year. That makes the EPS growth particularly close to the yearly share price growth of 40%. That suggests that the market sentiment around the company hasn't changed much over that time. Indeed, it would appear the share price is reacting to the EPS.
The graphic below depicts how EPS has changed over time (unveil the exact values by clicking on the image).
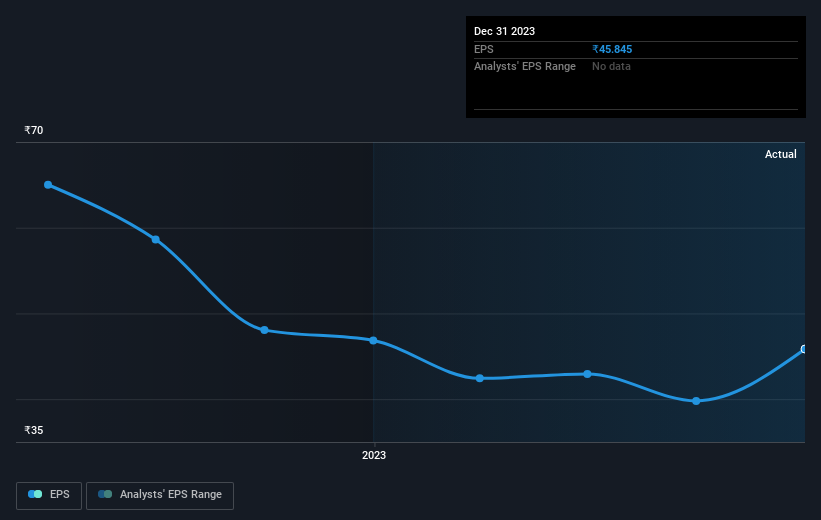
Dive deeper into Globus Spirits' key metrics by checking this interactive graph of Globus Spirits's earnings, revenue and cash flow.
What About Dividends?
As well as measuring the share price return, investors should also consider the total shareholder return (TSR). Whereas the share price return only reflects the change in the share price, the TSR includes the value of dividends (assuming they were reinvested) and the benefit of any discounted capital raising or spin-off. Arguably, the TSR gives a more comprehensive picture of the return generated by a stock. As it happens, Globus Spirits' TSR for the last 5 years was 442%, which exceeds the share price return mentioned earlier. And there's no prize for guessing that the dividend payments largely explain the divergence!
A Different Perspective
Globus Spirits shareholders are down 2.7% for the year (even including dividends), but the market itself is up 51%. Even the share prices of good stocks drop sometimes, but we want to see improvements in the fundamental metrics of a business, before getting too interested. Longer term investors wouldn't be so upset, since they would have made 40%, each year, over five years. If the fundamental data continues to indicate long term sustainable growth, the current sell-off could be an opportunity worth considering. While it is well worth considering the different impacts that market conditions can have on the share price, there are other factors that are even more important. For instance, we've identified 1 warning sign for Globus Spirits that you should be aware of.
If you would prefer to check out another company -- one with potentially superior financials -- then do not miss this free list of companies that have proven they can grow earnings.
Please note, the market returns quoted in this article reflect the market weighted average returns of stocks that currently trade on Indian exchanges.
New: Manage All Your Stock Portfolios in One Place
We've created the ultimate portfolio companion for stock investors, and it's free.
• Connect an unlimited number of Portfolios and see your total in one currency
• Be alerted to new Warning Signs or Risks via email or mobile
• Track the Fair Value of your stocks
Have feedback on this article? Concerned about the content? Get in touch with us directly. Alternatively, email editorial-team (at) simplywallst.com.
This article by Simply Wall St is general in nature. We provide commentary based on historical data and analyst forecasts only using an unbiased methodology and our articles are not intended to be financial advice. It does not constitute a recommendation to buy or sell any stock, and does not take account of your objectives, or your financial situation. We aim to bring you long-term focused analysis driven by fundamental data. Note that our analysis may not factor in the latest price-sensitive company announcements or qualitative material. Simply Wall St has no position in any stocks mentioned.
About NSEI:GLOBUSSPR
Excellent balance sheet low.
Similar Companies
Market Insights

Community Narratives

