- India
- /
- Oil and Gas
- /
- NSEI:SELAN
Selan Exploration Technology (NSE:SELAN) jumps 11% this week, though earnings growth is still tracking behind three-year shareholder returns


Investing can be hard but the potential fo an individual stock to pay off big time inspires us. You won't get it right every time, but when you do, the returns can be truly splendid. For example, the Selan Exploration Technology Limited (NSE:SELAN) share price is up a whopping 320% in the last three years, a handsome return for long term holders. It's also good to see the share price up 45% over the last quarter.
After a strong gain in the past week, it's worth seeing if longer term returns have been driven by improving fundamentals.
See our latest analysis for Selan Exploration Technology
While the efficient markets hypothesis continues to be taught by some, it has been proven that markets are over-reactive dynamic systems, and investors are not always rational. By comparing earnings per share (EPS) and share price changes over time, we can get a feel for how investor attitudes to a company have morphed over time.
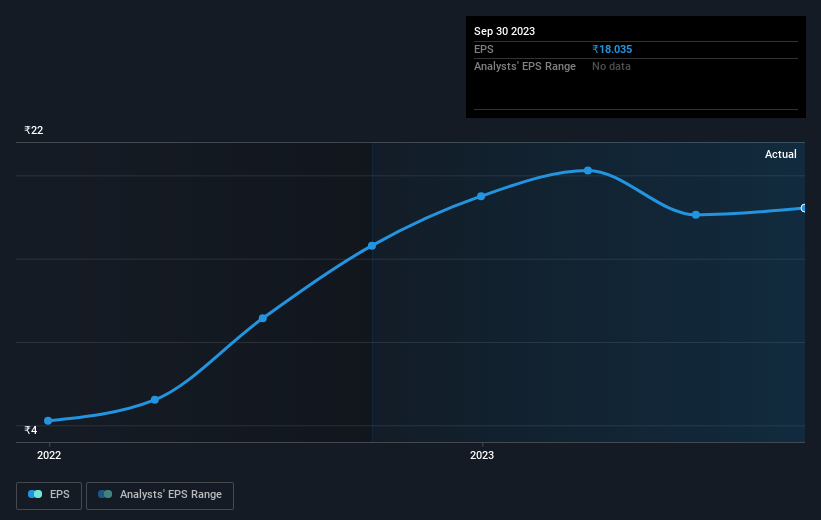
Selan Exploration Technology was able to grow its EPS at 47% per year over three years, sending the share price higher. In comparison, the 61% per year gain in the share price outpaces the EPS growth. This suggests that, as the business progressed over the last few years, it gained the confidence of market participants. That's not necessarily surprising considering the three-year track record of earnings growth.
You can see how EPS has changed over time in the image below (click on the chart to see the exact values).
It might be well worthwhile taking a look at our free report on Selan Exploration Technology's earnings, revenue and cash flow.
What About The Total Shareholder Return (TSR)?
We'd be remiss not to mention the difference between Selan Exploration Technology's total shareholder return (TSR) and its share price return. The TSR attempts to capture the value of dividends (as if they were reinvested) as well as any spin-offs or discounted capital raisings offered to shareholders. Its history of dividend payouts mean that Selan Exploration Technology's TSR of 351% over the last 3 years is better than the share price return.
A Different Perspective
It's nice to see that Selan Exploration Technology shareholders have received a total shareholder return of 74% over the last year. Since the one-year TSR is better than the five-year TSR (the latter coming in at 27% per year), it would seem that the stock's performance has improved in recent times. In the best case scenario, this may hint at some real business momentum, implying that now could be a great time to delve deeper. While it is well worth considering the different impacts that market conditions can have on the share price, there are other factors that are even more important. For instance, we've identified 3 warning signs for Selan Exploration Technology (2 shouldn't be ignored) that you should be aware of.
But note: Selan Exploration Technology may not be the best stock to buy. So take a peek at this free list of interesting companies with past earnings growth (and further growth forecast).
Please note, the market returns quoted in this article reflect the market weighted average returns of stocks that currently trade on Indian exchanges.
New: Manage All Your Stock Portfolios in One Place
We've created the ultimate portfolio companion for stock investors, and it's free.
• Connect an unlimited number of Portfolios and see your total in one currency
• Be alerted to new Warning Signs or Risks via email or mobile
• Track the Fair Value of your stocks
Have feedback on this article? Concerned about the content? Get in touch with us directly. Alternatively, email editorial-team (at) simplywallst.com.
This article by Simply Wall St is general in nature. We provide commentary based on historical data and analyst forecasts only using an unbiased methodology and our articles are not intended to be financial advice. It does not constitute a recommendation to buy or sell any stock, and does not take account of your objectives, or your financial situation. We aim to bring you long-term focused analysis driven by fundamental data. Note that our analysis may not factor in the latest price-sensitive company announcements or qualitative material. Simply Wall St has no position in any stocks mentioned.
About NSEI:SELAN
Selan Exploration Technology
Explores for and produces crude oil and natural gas in India.
Flawless balance sheet with proven track record.
