- India
- /
- Oil and Gas
- /
- NSEI:HINDPETRO
Are Hindustan Petroleum Corporation Limited (NSE:HINDPETRO) Investors Paying Above The Intrinsic Value?


Key Insights
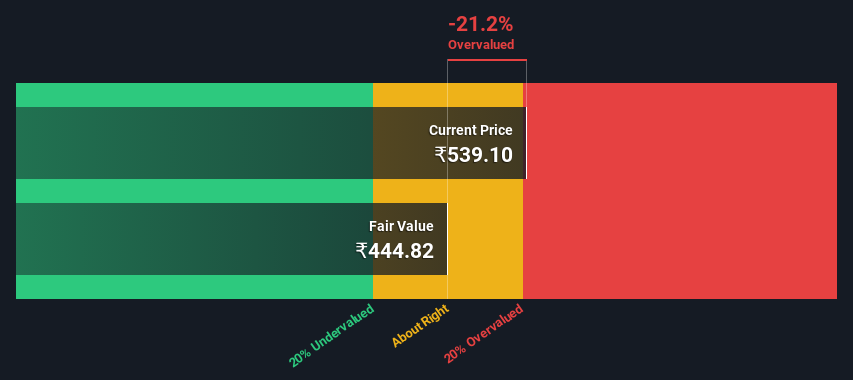
- The projected fair value for Hindustan Petroleum is ₹445 based on 2 Stage Free Cash Flow to Equity
- Hindustan Petroleum is estimated to be 21% overvalued based on current share price of ₹539
- Our fair value estimate is similar to Hindustan Petroleum's analyst price target of ₹441
Does the February share price for Hindustan Petroleum Corporation Limited (NSE:HINDPETRO) reflect what it's really worth? Today, we will estimate the stock's intrinsic value by taking the forecast future cash flows of the company and discounting them back to today's value. Our analysis will employ the Discounted Cash Flow (DCF) model. There's really not all that much to it, even though it might appear quite complex.
Companies can be valued in a lot of ways, so we would point out that a DCF is not perfect for every situation. If you still have some burning questions about this type of valuation, take a look at the Simply Wall St analysis model.
Check out our latest analysis for Hindustan Petroleum
The Calculation
We're using the 2-stage growth model, which simply means we take in account two stages of company's growth. In the initial period the company may have a higher growth rate and the second stage is usually assumed to have a stable growth rate. In the first stage we need to estimate the cash flows to the business over the next ten years. Where possible we use analyst estimates, but when these aren't available we extrapolate the previous free cash flow (FCF) from the last estimate or reported value. We assume companies with shrinking free cash flow will slow their rate of shrinkage, and that companies with growing free cash flow will see their growth rate slow, over this period. We do this to reflect that growth tends to slow more in the early years than it does in later years.
A DCF is all about the idea that a dollar in the future is less valuable than a dollar today, so we need to discount the sum of these future cash flows to arrive at a present value estimate:
10-year free cash flow (FCF) forecast
| 2024 | 2025 | 2026 | 2027 | 2028 | 2029 | 2030 | 2031 | 2032 | 2033 | |
| Levered FCF (₹, Millions) | ₹108.3b | ₹40.0b | ₹57.0b | ₹71.1b | ₹84.8b | ₹98.0b | ₹110.6b | ₹122.8b | ₹134.7b | ₹146.6b |
| Growth Rate Estimate Source | Analyst x5 | Analyst x4 | Analyst x4 | Est @ 24.67% | Est @ 19.28% | Est @ 15.51% | Est @ 12.87% | Est @ 11.02% | Est @ 9.73% | Est @ 8.82% |
| Present Value (₹, Millions) Discounted @ 18% | ₹91.4k | ₹28.5k | ₹34.4k | ₹36.2k | ₹36.4k | ₹35.5k | ₹33.9k | ₹31.8k | ₹29.4k | ₹27.0k |
("Est" = FCF growth rate estimated by Simply Wall St)
Present Value of 10-year Cash Flow (PVCF) = ₹385b
The second stage is also known as Terminal Value, this is the business's cash flow after the first stage. The Gordon Growth formula is used to calculate Terminal Value at a future annual growth rate equal to the 5-year average of the 10-year government bond yield of 6.7%. We discount the terminal cash flows to today's value at a cost of equity of 18%.
Terminal Value (TV)= FCF2033 × (1 + g) ÷ (r – g) = ₹147b× (1 + 6.7%) ÷ (18%– 6.7%) = ₹1.3t
Present Value of Terminal Value (PVTV)= TV / (1 + r)10= ₹1.3t÷ ( 1 + 18%)10= ₹246b
The total value is the sum of cash flows for the next ten years plus the discounted terminal value, which results in the Total Equity Value, which in this case is ₹631b. In the final step we divide the equity value by the number of shares outstanding. Relative to the current share price of ₹539, the company appears slightly overvalued at the time of writing. Remember though, that this is just an approximate valuation, and like any complex formula - garbage in, garbage out.
Important Assumptions
We would point out that the most important inputs to a discounted cash flow are the discount rate and of course the actual cash flows. You don't have to agree with these inputs, I recommend redoing the calculations yourself and playing with them. The DCF also does not consider the possible cyclicality of an industry, or a company's future capital requirements, so it does not give a full picture of a company's potential performance. Given that we are looking at Hindustan Petroleum as potential shareholders, the cost of equity is used as the discount rate, rather than the cost of capital (or weighted average cost of capital, WACC) which accounts for debt. In this calculation we've used 18%, which is based on a levered beta of 1.499. Beta is a measure of a stock's volatility, compared to the market as a whole. We get our beta from the industry average beta of globally comparable companies, with an imposed limit between 0.8 and 2.0, which is a reasonable range for a stable business.
SWOT Analysis for Hindustan Petroleum
- Debt is well covered by earnings and cashflows.
- Dividend is in the top 25% of dividend payers in the market.
- No major weaknesses identified for HINDPETRO.
- Good value based on P/E ratio compared to estimated Fair P/E ratio.
- Annual earnings are forecast to decline for the next 3 years.
Next Steps:
Valuation is only one side of the coin in terms of building your investment thesis, and it is only one of many factors that you need to assess for a company. The DCF model is not a perfect stock valuation tool. Preferably you'd apply different cases and assumptions and see how they would impact the company's valuation. For instance, if the terminal value growth rate is adjusted slightly, it can dramatically alter the overall result. Why is the intrinsic value lower than the current share price? For Hindustan Petroleum, we've put together three relevant items you should further examine:
- Risks: For example, we've discovered 3 warning signs for Hindustan Petroleum (1 is significant!) that you should be aware of before investing here.
- Future Earnings: How does HINDPETRO's growth rate compare to its peers and the wider market? Dig deeper into the analyst consensus number for the upcoming years by interacting with our free analyst growth expectation chart.
- Other High Quality Alternatives: Do you like a good all-rounder? Explore our interactive list of high quality stocks to get an idea of what else is out there you may be missing!
PS. Simply Wall St updates its DCF calculation for every Indian stock every day, so if you want to find the intrinsic value of any other stock just search here.
Valuation is complex, but we're here to simplify it.
Discover if Hindustan Petroleum might be undervalued or overvalued with our detailed analysis, featuring fair value estimates, potential risks, dividends, insider trades, and its financial condition.
Access Free AnalysisHave feedback on this article? Concerned about the content? Get in touch with us directly. Alternatively, email editorial-team (at) simplywallst.com.
This article by Simply Wall St is general in nature. We provide commentary based on historical data and analyst forecasts only using an unbiased methodology and our articles are not intended to be financial advice. It does not constitute a recommendation to buy or sell any stock, and does not take account of your objectives, or your financial situation. We aim to bring you long-term focused analysis driven by fundamental data. Note that our analysis may not factor in the latest price-sensitive company announcements or qualitative material. Simply Wall St has no position in any stocks mentioned.
About NSEI:HINDPETRO
Hindustan Petroleum
Engages in the refining and marketing of petroleum products in India and internationally.
Average dividend payer and fair value.
Similar Companies
Market Insights

Community Narratives

