
Advertisement
- India
- /
- Oil and Gas
- /
- NSEI:CHENNPETRO
A Piece Of The Puzzle Missing From Chennai Petroleum Corporation Limited's (NSE:CHENNPETRO) 28% Share Price Climb
Chennai Petroleum Corporation Limited (NSE:CHENNPETRO) shareholders would be excited to see that the share price has had a great month, posting a 28% gain and recovering from prior weakness. Unfortunately, the gains of the last month did little to right the losses of the last year with the stock still down 28% over that time.
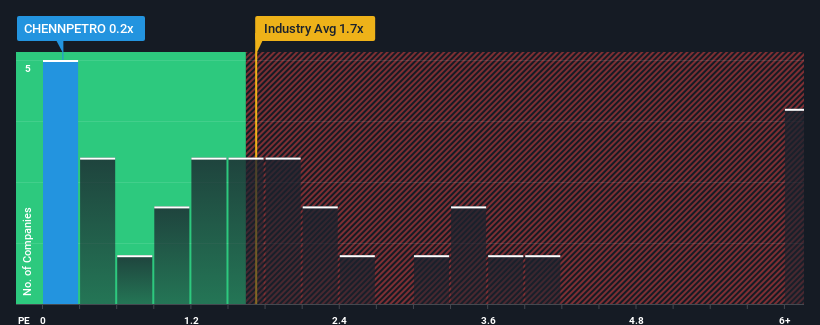
Although its price has surged higher, Chennai Petroleum may still be sending bullish signals at the moment with its price-to-sales (or "P/S") ratio of 0.2x, since almost half of all companies in the Oil and Gas industry in India have P/S ratios greater than 1.7x and even P/S higher than 4x are not unusual. However, the P/S might be low for a reason and it requires further investigation to determine if it's justified.
Check out our latest analysis for Chennai Petroleum
What Does Chennai Petroleum's P/S Mean For Shareholders?
Chennai Petroleum could be doing better as its revenue has been going backwards lately while most other companies have been seeing positive revenue growth. It seems that many are expecting the poor revenue performance to persist, which has repressed the P/S ratio. If you still like the company, you'd be hoping this isn't the case so that you could potentially pick up some stock while it's out of favour.
If you'd like to see what analysts are forecasting going forward, you should check out our free report on Chennai Petroleum.What Are Revenue Growth Metrics Telling Us About The Low P/S?
Chennai Petroleum's P/S ratio would be typical for a company that's only expected to deliver limited growth, and importantly, perform worse than the industry.
Taking a look back first, the company's revenue growth last year wasn't something to get excited about as it posted a disappointing decline of 9.9%. However, a few very strong years before that means that it was still able to grow revenue by an impressive 68% in total over the last three years. Although it's been a bumpy ride, it's still fair to say the revenue growth recently has been more than adequate for the company.
Looking ahead now, revenue is anticipated to climb by 7.6% during the coming year according to the lone analyst following the company. With the industry predicted to deliver 5.8% growth , the company is positioned for a comparable revenue result.
With this in consideration, we find it intriguing that Chennai Petroleum's P/S is lagging behind its industry peers. It may be that most investors are not convinced the company can achieve future growth expectations.
The Key Takeaway
Chennai Petroleum's stock price has surged recently, but its but its P/S still remains modest. Using the price-to-sales ratio alone to determine if you should sell your stock isn't sensible, however it can be a practical guide to the company's future prospects.
Our examination of Chennai Petroleum's revealed that its P/S remains low despite analyst forecasts of revenue growth matching the wider industry. Despite average revenue growth estimates, there could be some unobserved threats keeping the P/S low. It appears some are indeed anticipating revenue instability, because these conditions should normally provide more support to the share price.
Before you take the next step, you should know about the 3 warning signs for Chennai Petroleum (1 is significant!) that we have uncovered.
It's important to make sure you look for a great company, not just the first idea you come across. So if growing profitability aligns with your idea of a great company, take a peek at this free list of interesting companies with strong recent earnings growth (and a low P/E).
New: AI Stock Screener & Alerts
Our new AI Stock Screener scans the market every day to uncover opportunities.
• Dividend Powerhouses (3%+ Yield)
• Undervalued Small Caps with Insider Buying
• High growth Tech and AI Companies
Or build your own from over 50 metrics.
Have feedback on this article? Concerned about the content? Get in touch with us directly. Alternatively, email editorial-team (at) simplywallst.com.
This article by Simply Wall St is general in nature. We provide commentary based on historical data and analyst forecasts only using an unbiased methodology and our articles are not intended to be financial advice. It does not constitute a recommendation to buy or sell any stock, and does not take account of your objectives, or your financial situation. We aim to bring you long-term focused analysis driven by fundamental data. Note that our analysis may not factor in the latest price-sensitive company announcements or qualitative material. Simply Wall St has no position in any stocks mentioned.
About NSEI:CHENNPETRO
Excellent balance sheet and good value.
Similar Companies
Market Insights

Advertisement
Community Narratives
Kodiak AI - a potential 100 bagger opportunity?
Fair Value US$14.00|44.7% undervalued
DA
Community Contributor
A Fair Price for a Great Business Facing Real Threats
Fair Value US$383.06|13.0% undervalued
IM
Community Contributor
AXON And Shopify Integration Will Unlock Global Mobile Advertising
Fair Value US$646.30|0% overvalued
AN
Based on Analyst Price Targets