- India
- /
- Oil and Gas
- /
- NSEI:BPCL
Bharat Petroleum Corporation Limited (NSE:BPCL) Held Back By Insufficient Growth Even After Shares Climb 34%

Despite an already strong run, Bharat Petroleum Corporation Limited (NSE:BPCL) shares have been powering on, with a gain of 34% in the last thirty days. Looking back a bit further, it's encouraging to see the stock is up 84% in the last year.
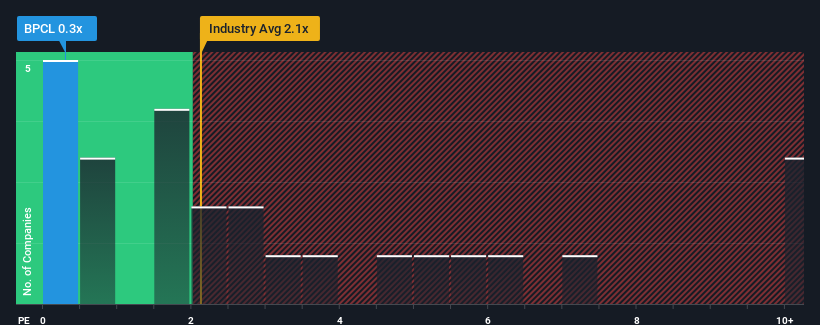
Even after such a large jump in price, Bharat Petroleum's price-to-sales (or "P/S") ratio of 0.3x might still make it look like a buy right now compared to the Oil and Gas industry in India, where around half of the companies have P/S ratios above 2.1x and even P/S above 6x are quite common. However, the P/S might be low for a reason and it requires further investigation to determine if it's justified.
See our latest analysis for Bharat Petroleum
What Does Bharat Petroleum's P/S Mean For Shareholders?
Bharat Petroleum could be doing better as its revenue has been going backwards lately while most other companies have been seeing positive revenue growth. Perhaps the P/S remains low as investors think the prospects of strong revenue growth aren't on the horizon. If you still like the company, you'd be hoping this isn't the case so that you could potentially pick up some stock while it's out of favour.
If you'd like to see what analysts are forecasting going forward, you should check out our free report on Bharat Petroleum.Is There Any Revenue Growth Forecasted For Bharat Petroleum?
The only time you'd be truly comfortable seeing a P/S as low as Bharat Petroleum's is when the company's growth is on track to lag the industry.
In reviewing the last year of financials, we were disheartened to see the company's revenues fell to the tune of 2.1%. However, a few very strong years before that means that it was still able to grow revenue by an impressive 102% in total over the last three years. Accordingly, while they would have preferred to keep the run going, shareholders would definitely welcome the medium-term rates of revenue growth.
Turning to the outlook, the next year should bring diminished returns, with revenue decreasing 0.5% as estimated by the analysts watching the company. With the industry predicted to deliver 7.5% growth, that's a disappointing outcome.
With this information, we are not surprised that Bharat Petroleum is trading at a P/S lower than the industry. However, shrinking revenues are unlikely to lead to a stable P/S over the longer term. There's potential for the P/S to fall to even lower levels if the company doesn't improve its top-line growth.
What Does Bharat Petroleum's P/S Mean For Investors?
Bharat Petroleum's stock price has surged recently, but its but its P/S still remains modest. Typically, we'd caution against reading too much into price-to-sales ratios when settling on investment decisions, though it can reveal plenty about what other market participants think about the company.
As we suspected, our examination of Bharat Petroleum's analyst forecasts revealed that its outlook for shrinking revenue is contributing to its low P/S. At this stage investors feel the potential for an improvement in revenue isn't great enough to justify a higher P/S ratio. Unless there's material change, it's hard to envision a situation where the stock price will rise drastically.
Before you settle on your opinion, we've discovered 3 warning signs for Bharat Petroleum (1 shouldn't be ignored!) that you should be aware of.
If you're unsure about the strength of Bharat Petroleum's business, why not explore our interactive list of stocks with solid business fundamentals for some other companies you may have missed.
Valuation is complex, but we're here to simplify it.
Discover if Bharat Petroleum might be undervalued or overvalued with our detailed analysis, featuring fair value estimates, potential risks, dividends, insider trades, and its financial condition.
Access Free AnalysisHave feedback on this article? Concerned about the content? Get in touch with us directly. Alternatively, email editorial-team (at) simplywallst.com.
This article by Simply Wall St is general in nature. We provide commentary based on historical data and analyst forecasts only using an unbiased methodology and our articles are not intended to be financial advice. It does not constitute a recommendation to buy or sell any stock, and does not take account of your objectives, or your financial situation. We aim to bring you long-term focused analysis driven by fundamental data. Note that our analysis may not factor in the latest price-sensitive company announcements or qualitative material. Simply Wall St has no position in any stocks mentioned.
About NSEI:BPCL
Bharat Petroleum
Primarily engages in refining crude oil and marketing petroleum products in India and internationally.
Adequate balance sheet average dividend payer.
