
Advertisement
- India
- /
- Capital Markets
- /
- NSEI:HDFCAMC
HDFC Asset Management's (NSE:HDFCAMC) three-year earnings growth trails the notable shareholder returns
You can receive the average market return by buying a low-cost index fund. But you can make better returns by buying undervalued shares. To wit, HDFC Asset Management Company Limited (NSE:HDFCAMC) shares are up 50% in three years, besting the market return. The bad news is that the share price seems to lack positive momentum recently, since it has dropped 22% in the last year.
The past week has proven to be lucrative for HDFC Asset Management investors, so let's see if fundamentals drove the company's three-year performance.
Check out our latest analysis for HDFC Asset Management
To quote Buffett, 'Ships will sail around the world but the Flat Earth Society will flourish. There will continue to be wide discrepancies between price and value in the marketplace...' One imperfect but simple way to consider how the market perception of a company has shifted is to compare the change in the earnings per share (EPS) with the share price movement.
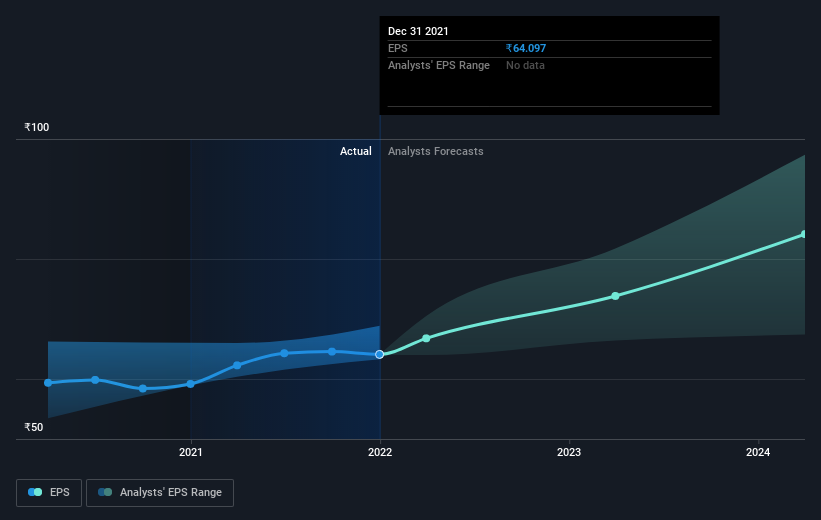
HDFC Asset Management was able to grow its EPS at 17% per year over three years, sending the share price higher. We don't think it is entirely coincidental that the EPS growth is reasonably close to the 15% average annual increase in the share price. That suggests that the market sentiment around the company hasn't changed much over that time. Quite to the contrary, the share price has arguably reflected the EPS growth.
You can see below how EPS has changed over time (discover the exact values by clicking on the image).
We're pleased to report that the CEO is remunerated more modestly than most CEOs at similarly capitalized companies. It's always worth keeping an eye on CEO pay, but a more important question is whether the company will grow earnings throughout the years. Dive deeper into the earnings by checking this interactive graph of HDFC Asset Management's earnings, revenue and cash flow.
What About Dividends?
When looking at investment returns, it is important to consider the difference between total shareholder return (TSR) and share price return. Whereas the share price return only reflects the change in the share price, the TSR includes the value of dividends (assuming they were reinvested) and the benefit of any discounted capital raising or spin-off. So for companies that pay a generous dividend, the TSR is often a lot higher than the share price return. In the case of HDFC Asset Management, it has a TSR of 55% for the last 3 years. That exceeds its share price return that we previously mentioned. And there's no prize for guessing that the dividend payments largely explain the divergence!
A Different Perspective
The last twelve months weren't great for HDFC Asset Management shares, which cost holders 21%, including dividends, while the market was up about 26%. Of course the long term matters more than the short term, and even great stocks will sometimes have a poor year. Investors are up over three years, booking 16% per year, much better than the more recent returns. Sometimes when a good quality long term winner has a weak period, it's turns out to be an opportunity, but you really need to be sure that the quality is there. It's always interesting to track share price performance over the longer term. But to understand HDFC Asset Management better, we need to consider many other factors. For example, we've discovered 1 warning sign for HDFC Asset Management that you should be aware of before investing here.
For those who like to find winning investments this free list of growing companies with recent insider purchasing, could be just the ticket.
Please note, the market returns quoted in this article reflect the market weighted average returns of stocks that currently trade on IN exchanges.
Valuation is complex, but we're here to simplify it.
Discover if HDFC Asset Management might be undervalued or overvalued with our detailed analysis, featuring fair value estimates, potential risks, dividends, insider trades, and its financial condition.
Access Free AnalysisHave feedback on this article? Concerned about the content? Get in touch with us directly. Alternatively, email editorial-team (at) simplywallst.com.
This article by Simply Wall St is general in nature. We provide commentary based on historical data and analyst forecasts only using an unbiased methodology and our articles are not intended to be financial advice. It does not constitute a recommendation to buy or sell any stock, and does not take account of your objectives, or your financial situation. We aim to bring you long-term focused analysis driven by fundamental data. Note that our analysis may not factor in the latest price-sensitive company announcements or qualitative material. Simply Wall St has no position in any stocks mentioned.
About NSEI:HDFCAMC
Outstanding track record with excellent balance sheet and pays a dividend.
Market Insights

Advertisement
Community Narratives
MINISO's fair value is projected at 26.69 with an anticipated PE ratio shift of 20x
Fair Value US$24.03|11.0% undervalued
BE
Community Contributor
Procter & Gamble: A Dividend Giant Facing Slowing Growth
Fair Value US$119.81|23.3% overvalued
AN
Community Contributor
Eli Lilly's Future Growth Driven by Tirzepatide and Favorable Market Conditions
Fair Value US$1.19k|13.8% undervalued
EA
Community Contributor