Vardhman Textiles' (NSE:VTL) five-year total shareholder returns outpace the underlying earnings growth

Vardhman Textiles Limited (NSE:VTL) shareholders might be concerned after seeing the share price drop 12% in the last month. But that doesn't change the fact that shareholders have received really good returns over the last five years. In fact, the share price is 173% higher today. We think it's more important to dwell on the long term returns than the short term returns. Only time will tell if there is still too much optimism currently reflected in the share price.
In light of the stock dropping 4.0% in the past week, we want to investigate the longer term story, and see if fundamentals have been the driver of the company's positive five-year return.
View our latest analysis for Vardhman Textiles
While markets are a powerful pricing mechanism, share prices reflect investor sentiment, not just underlying business performance. One way to examine how market sentiment has changed over time is to look at the interaction between a company's share price and its earnings per share (EPS).
During five years of share price growth, Vardhman Textiles achieved compound earnings per share (EPS) growth of 0.8% per year. This EPS growth is slower than the share price growth of 22% per year, over the same period. So it's fair to assume the market has a higher opinion of the business than it did five years ago. And that's hardly shocking given the track record of growth.
You can see below how EPS has changed over time (discover the exact values by clicking on the image).
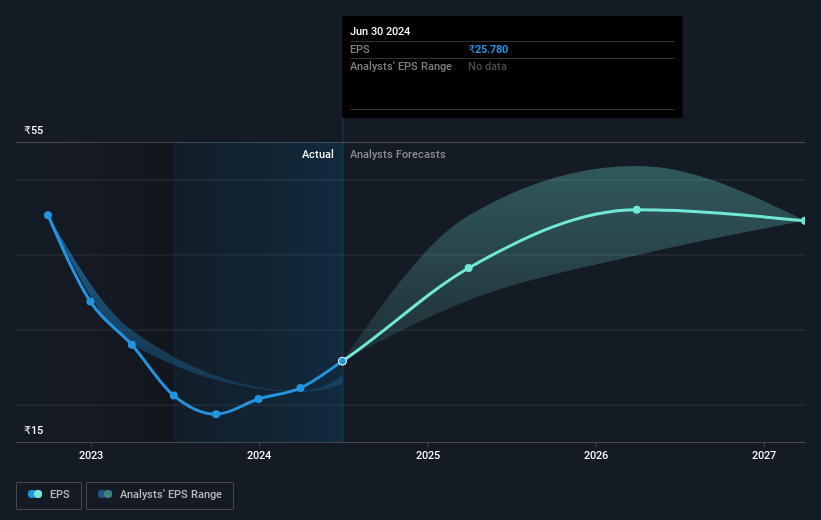
We know that Vardhman Textiles has improved its bottom line lately, but is it going to grow revenue? This free report showing analyst revenue forecasts should help you figure out if the EPS growth can be sustained.
What About Dividends?
It is important to consider the total shareholder return, as well as the share price return, for any given stock. The TSR is a return calculation that accounts for the value of cash dividends (assuming that any dividend received was reinvested) and the calculated value of any discounted capital raisings and spin-offs. So for companies that pay a generous dividend, the TSR is often a lot higher than the share price return. In the case of Vardhman Textiles, it has a TSR of 189% for the last 5 years. That exceeds its share price return that we previously mentioned. The dividends paid by the company have thusly boosted the total shareholder return.
A Different Perspective
Vardhman Textiles shareholders have received returns of 46% over twelve months (even including dividends), which isn't far from the general market return. That gain looks pretty satisfying, and it is even better than the five-year TSR of 24% per year. It is possible that management foresight will bring growth well into the future, even if the share price slows down. While it is well worth considering the different impacts that market conditions can have on the share price, there are other factors that are even more important. Take risks, for example - Vardhman Textiles has 1 warning sign we think you should be aware of.
If you are like me, then you will not want to miss this free list of undervalued small caps that insiders are buying.
Please note, the market returns quoted in this article reflect the market weighted average returns of stocks that currently trade on Indian exchanges.
The New Payments ETF Is Live on NASDAQ:
Money is moving to real-time rails, and a newly listed ETF now gives investors direct exposure. Fast settlement. Institutional custody. Simple access.
Explore how this launch could reshape portfolios
Sponsored ContentNew: Manage All Your Stock Portfolios in One Place
We've created the ultimate portfolio companion for stock investors, and it's free.
• Connect an unlimited number of Portfolios and see your total in one currency
• Be alerted to new Warning Signs or Risks via email or mobile
• Track the Fair Value of your stocks
Have feedback on this article? Concerned about the content? Get in touch with us directly. Alternatively, email editorial-team (at) simplywallst.com.
This article by Simply Wall St is general in nature. We provide commentary based on historical data and analyst forecasts only using an unbiased methodology and our articles are not intended to be financial advice. It does not constitute a recommendation to buy or sell any stock, and does not take account of your objectives, or your financial situation. We aim to bring you long-term focused analysis driven by fundamental data. Note that our analysis may not factor in the latest price-sensitive company announcements or qualitative material. Simply Wall St has no position in any stocks mentioned.
About NSEI:VTL
Vardhman Textiles
Manufactures, purchases, and sells textiles and fibres in India and internationally.
Undervalued with excellent balance sheet.
Similar Companies
Market Insights

Weekly Picks

Early mover in a fast growing industry. Likely to experience share price volatility as they scale


A case for CA$31.80 (undiluted), aka 8,616% upside from CA$0.37 (an 86 bagger!).


Moderation and Stabilisation: HOLD: Fair Price based on a 4-year Cycle is $12.08
Recently Updated Narratives


Positioned to Win as the Streaming Wars Settle

Meta’s Bold Bet on AI Pays Off

ADP Stock: Solid Fundamentals, But AI Investments Test Its Margin Resilience
Popular Narratives


Crazy Undervalued 42 Baggers Silver Play (Active & Running Mine)


NVDA: Expanding AI Demand Will Drive Major Data Center Investments Through 2026

The AI Infrastructure Giant Grows Into Its Valuation
Trending Discussion

