
Advertisement
Despite shrinking by ₹1.7b in the past week, Sutlej Textiles and Industries (NSE:SUTLEJTEX) shareholders are still up 144% over 5 years
It's been a soft week for Sutlej Textiles and Industries Limited (NSE:SUTLEJTEX) shares, which are down 14%. But that doesn't change the fact that shareholders have received really good returns over the last five years. In fact, the share price is 129% higher today. So while it's never fun to see a share price fall, it's important to look at a longer time horizon. Ultimately business performance will determine whether the stock price continues the positive long term trend.
While this past week has detracted from the company's five-year return, let's look at the recent trends of the underlying business and see if the gains have been in alignment.
Check out our latest analysis for Sutlej Textiles and Industries
Sutlej Textiles and Industries isn't currently profitable, so most analysts would look to revenue growth to get an idea of how fast the underlying business is growing. Generally speaking, companies without profits are expected to grow revenue every year, and at a good clip. Some companies are willing to postpone profitability to grow revenue faster, but in that case one would hope for good top-line growth to make up for the lack of earnings.
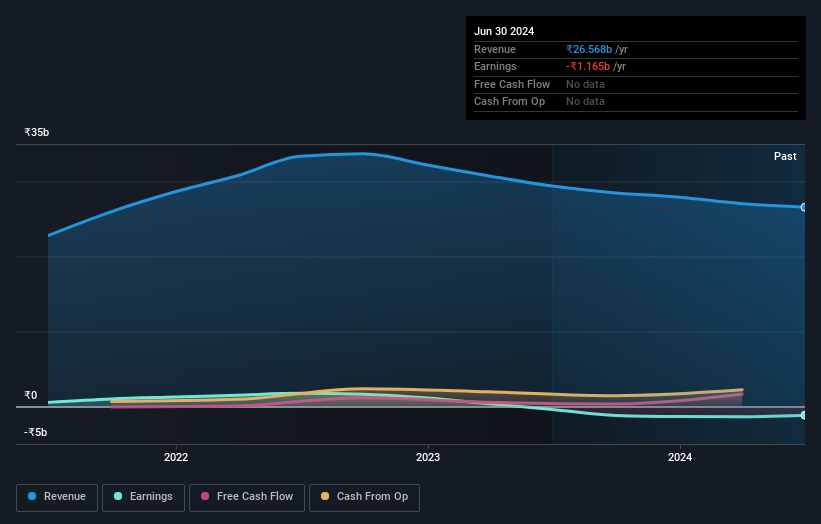
In the last 5 years Sutlej Textiles and Industries saw its revenue grow at 6.3% per year. That's a pretty good long term growth rate. We'd argue this growth has been reflected in the share price which has climbed at a rate of 18% per year over in that time. It's well worth monitoring the growth trend in revenue, because if growth accelerates, that might signal an opportunity. When a growth trend accelerates, be it in revenue or earnings, it can indicate an inflection point for the business, which is can often be an opportunity for investors.
You can see how earnings and revenue have changed over time in the image below (click on the chart to see the exact values).
Balance sheet strength is crucial. It might be well worthwhile taking a look at our free report on how its financial position has changed over time.
What About The Total Shareholder Return (TSR)?
Investors should note that there's a difference between Sutlej Textiles and Industries' total shareholder return (TSR) and its share price change, which we've covered above. Arguably the TSR is a more complete return calculation because it accounts for the value of dividends (as if they were reinvested), along with the hypothetical value of any discounted capital that have been offered to shareholders. Dividends have been really beneficial for Sutlej Textiles and Industries shareholders, and that cash payout contributed to why its TSR of 144%, over the last 5 years, is better than the share price return.
A Different Perspective
Sutlej Textiles and Industries shareholders gained a total return of 13% during the year. But that was short of the market average. On the bright side, the longer term returns (running at about 19% a year, over half a decade) look better. It may well be that this is a business worth popping on the watching, given the continuing positive reception, over time, from the market. While it is well worth considering the different impacts that market conditions can have on the share price, there are other factors that are even more important. Even so, be aware that Sutlej Textiles and Industries is showing 2 warning signs in our investment analysis , and 1 of those is concerning...
We will like Sutlej Textiles and Industries better if we see some big insider buys. While we wait, check out this free list of undervalued stocks (mostly small caps) with considerable, recent, insider buying.
Please note, the market returns quoted in this article reflect the market weighted average returns of stocks that currently trade on Indian exchanges.
New: Manage All Your Stock Portfolios in One Place
We've created the ultimate portfolio companion for stock investors, and it's free.
• Connect an unlimited number of Portfolios and see your total in one currency
• Be alerted to new Warning Signs or Risks via email or mobile
• Track the Fair Value of your stocks
Have feedback on this article? Concerned about the content? Get in touch with us directly. Alternatively, email editorial-team (at) simplywallst.com.
This article by Simply Wall St is general in nature. We provide commentary based on historical data and analyst forecasts only using an unbiased methodology and our articles are not intended to be financial advice. It does not constitute a recommendation to buy or sell any stock, and does not take account of your objectives, or your financial situation. We aim to bring you long-term focused analysis driven by fundamental data. Note that our analysis may not factor in the latest price-sensitive company announcements or qualitative material. Simply Wall St has no position in any stocks mentioned.
About NSEI:SUTLEJTEX
Sutlej Textiles and Industries
Designs, manufactures, and distributes textiles to wholesalers, manufacturers, and retailers for the home furnishing industry in India, Bangladesh, Turkey, the United States of America, Hong Kong, Singapore, and internationally.
Low risk and slightly overvalued.
Similar Companies
Market Insights

Advertisement
Community Narratives
Kodiak AI - a potential 100 bagger opportunity?
Fair Value US$14.00|44.7% undervalued
DA
Community Contributor
A Fair Price for a Great Business Facing Real Threats
Fair Value US$383.06|10.4% undervalued
IM
Community Contributor
AXON And Shopify Integration Will Unlock Global Mobile Advertising
Fair Value US$646.30|12.4% undervalued
AN
Based on Analyst Price Targets