Further Upside For Shekhawati Poly-Yarn Limited (NSE:SPYL) Shares Could Introduce Price Risks After 26% Bounce


Despite an already strong run, Shekhawati Poly-Yarn Limited (NSE:SPYL) shares have been powering on, with a gain of 26% in the last thirty days. The last 30 days were the cherry on top of the stock's 308% gain in the last year, which is nothing short of spectacular.
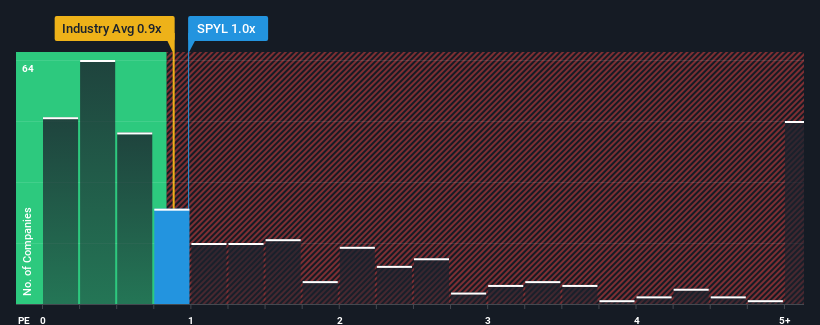
Although its price has surged higher, it's still not a stretch to say that Shekhawati Poly-Yarn's price-to-sales (or "P/S") ratio of 1x right now seems quite "middle-of-the-road" compared to the Luxury industry in India, where the median P/S ratio is around 0.9x. However, investors might be overlooking a clear opportunity or potential setback if there is no rational basis for the P/S.
See our latest analysis for Shekhawati Poly-Yarn
What Does Shekhawati Poly-Yarn's Recent Performance Look Like?
For instance, Shekhawati Poly-Yarn's receding revenue in recent times would have to be some food for thought. One possibility is that the P/S is moderate because investors think the company might still do enough to be in line with the broader industry in the near future. If not, then existing shareholders may be a little nervous about the viability of the share price.
Want the full picture on earnings, revenue and cash flow for the company? Then our free report on Shekhawati Poly-Yarn will help you shine a light on its historical performance.Do Revenue Forecasts Match The P/S Ratio?
The only time you'd be comfortable seeing a P/S like Shekhawati Poly-Yarn's is when the company's growth is tracking the industry closely.
In reviewing the last year of financials, we were disheartened to see the company's revenues fell to the tune of 78%. Even so, admirably revenue has lifted 109% in aggregate from three years ago, notwithstanding the last 12 months. Accordingly, while they would have preferred to keep the run going, shareholders would definitely welcome the medium-term rates of revenue growth.
When compared to the industry's one-year growth forecast of 12%, the most recent medium-term revenue trajectory is noticeably more alluring
In light of this, it's curious that Shekhawati Poly-Yarn's P/S sits in line with the majority of other companies. It may be that most investors are not convinced the company can maintain its recent growth rates.
What We Can Learn From Shekhawati Poly-Yarn's P/S?
Its shares have lifted substantially and now Shekhawati Poly-Yarn's P/S is back within range of the industry median. We'd say the price-to-sales ratio's power isn't primarily as a valuation instrument but rather to gauge current investor sentiment and future expectations.
To our surprise, Shekhawati Poly-Yarn revealed its three-year revenue trends aren't contributing to its P/S as much as we would have predicted, given they look better than current industry expectations. There could be some unobserved threats to revenue preventing the P/S ratio from matching this positive performance. It appears some are indeed anticipating revenue instability, because the persistence of these recent medium-term conditions would normally provide a boost to the share price.
Don't forget that there may be other risks. For instance, we've identified 3 warning signs for Shekhawati Poly-Yarn (2 are concerning) you should be aware of.
If you're unsure about the strength of Shekhawati Poly-Yarn's business, why not explore our interactive list of stocks with solid business fundamentals for some other companies you may have missed.
If you're looking to trade Shekhawati Industries, open an account with the lowest-cost platform trusted by professionals, Interactive Brokers.
With clients in over 200 countries and territories, and access to 160 markets, IBKR lets you trade stocks, options, futures, forex, bonds and funds from a single integrated account.
Enjoy no hidden fees, no account minimums, and FX conversion rates as low as 0.03%, far better than what most brokers offer.
Sponsored ContentNew: Manage All Your Stock Portfolios in One Place
We've created the ultimate portfolio companion for stock investors, and it's free.
• Connect an unlimited number of Portfolios and see your total in one currency
• Be alerted to new Warning Signs or Risks via email or mobile
• Track the Fair Value of your stocks
Have feedback on this article? Concerned about the content? Get in touch with us directly. Alternatively, email editorial-team (at) simplywallst.com.
This article by Simply Wall St is general in nature. We provide commentary based on historical data and analyst forecasts only using an unbiased methodology and our articles are not intended to be financial advice. It does not constitute a recommendation to buy or sell any stock, and does not take account of your objectives, or your financial situation. We aim to bring you long-term focused analysis driven by fundamental data. Note that our analysis may not factor in the latest price-sensitive company announcements or qualitative material. Simply Wall St has no position in any stocks mentioned.
About NSEI:SHEKHAWATI
Shekhawati Industries
Engages in the manufacture and sale of polyester texturized, and twisted yarns and knitted fabrics in India.
Flawless balance sheet low.
Market Insights

Community Narratives

