Sangam (India)'s (NSE:SANGAMIND) five-year earnings growth trails the massive shareholder returns


We think all investors should try to buy and hold high quality multi-year winners. While not every stock performs well, when investors win, they can win big. For example, the Sangam (India) Limited (NSE:SANGAMIND) share price is up a whopping 710% in the last half decade, a handsome return for long term holders. If that doesn't get you thinking about long term investing, we don't know what will. It's even up 17% in the last week. But this might be partly because the broader market had a good week last week, gaining 8.0%. Anyone who held for that rewarding ride would probably be keen to talk about it.
On the back of a solid 7-day performance, let's check what role the company's fundamentals have played in driving long term shareholder returns.
See our latest analysis for Sangam (India)
While the efficient markets hypothesis continues to be taught by some, it has been proven that markets are over-reactive dynamic systems, and investors are not always rational. By comparing earnings per share (EPS) and share price changes over time, we can get a feel for how investor attitudes to a company have morphed over time.
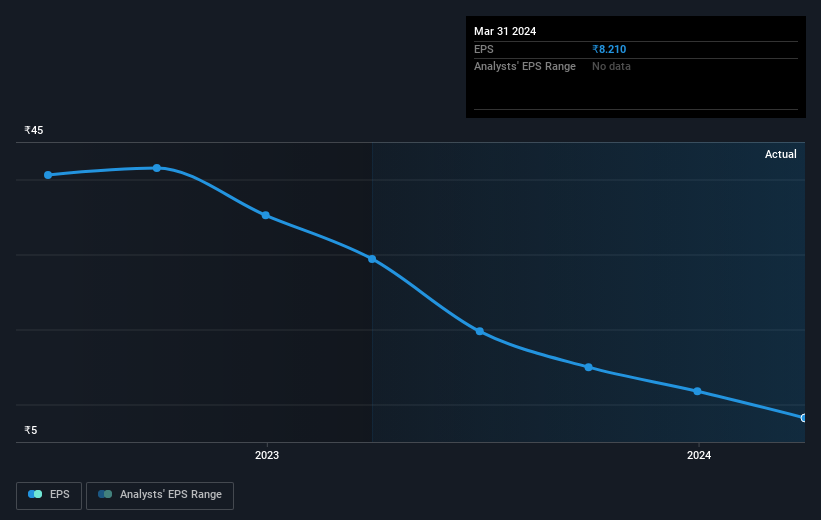
During five years of share price growth, Sangam (India) achieved compound earnings per share (EPS) growth of 19% per year. This EPS growth is lower than the 52% average annual increase in the share price. This suggests that market participants hold the company in higher regard, these days. That's not necessarily surprising considering the five-year track record of earnings growth. This favorable sentiment is reflected in its (fairly optimistic) P/E ratio of 51.62.
You can see below how EPS has changed over time (discover the exact values by clicking on the image).
It might be well worthwhile taking a look at our free report on Sangam (India)'s earnings, revenue and cash flow.
What About Dividends?
As well as measuring the share price return, investors should also consider the total shareholder return (TSR). The TSR incorporates the value of any spin-offs or discounted capital raisings, along with any dividends, based on the assumption that the dividends are reinvested. Arguably, the TSR gives a more comprehensive picture of the return generated by a stock. We note that for Sangam (India) the TSR over the last 5 years was 762%, which is better than the share price return mentioned above. The dividends paid by the company have thusly boosted the total shareholder return.
A Different Perspective
Sangam (India) shareholders are up 26% for the year (even including dividends). Unfortunately this falls short of the market return. If we look back over five years, the returns are even better, coming in at 54% per year for five years. Maybe the share price is just taking a breather while the business executes on its growth strategy. While it is well worth considering the different impacts that market conditions can have on the share price, there are other factors that are even more important. For instance, we've identified 4 warning signs for Sangam (India) (1 is a bit concerning) that you should be aware of.
Of course, you might find a fantastic investment by looking elsewhere. So take a peek at this free list of companies we expect will grow earnings.
Please note, the market returns quoted in this article reflect the market weighted average returns of stocks that currently trade on Indian exchanges.
New: Manage All Your Stock Portfolios in One Place
We've created the ultimate portfolio companion for stock investors, and it's free.
• Connect an unlimited number of Portfolios and see your total in one currency
• Be alerted to new Warning Signs or Risks via email or mobile
• Track the Fair Value of your stocks
Have feedback on this article? Concerned about the content? Get in touch with us directly. Alternatively, email editorial-team (at) simplywallst.com.
This article by Simply Wall St is general in nature. We provide commentary based on historical data and analyst forecasts only using an unbiased methodology and our articles are not intended to be financial advice. It does not constitute a recommendation to buy or sell any stock, and does not take account of your objectives, or your financial situation. We aim to bring you long-term focused analysis driven by fundamental data. Note that our analysis may not factor in the latest price-sensitive company announcements or qualitative material. Simply Wall St has no position in any stocks mentioned.
About NSEI:SANGAMIND
Sangam (India)
Engages in the manufacture and sale of PV-dyed yarns and denim fabrics in India.
Second-rate dividend payer low.
Similar Companies
Market Insights

Community Narratives

