- India
- /
- Consumer Durables
- /
- NSEI:ORIENTELEC
Orient Electric's (NSE:ORIENTELEC) three-year total shareholder returns outpace the underlying earnings growth


The worst result, after buying shares in a company (assuming no leverage), would be if you lose all the money you put in. But when you pick a company that is really flourishing, you can make more than 100%. For instance the Orient Electric Limited (NSE:ORIENTELEC) share price is 153% higher than it was three years ago. How nice for those who held the stock! But it's down 5.9% in the last week. But this could be related to the soft market, with stocks selling off around 5.3% in the last week.
Although Orient Electric has shed ₹4.9b from its market cap this week, let's take a look at its longer term fundamental trends and see if they've driven returns.
See our latest analysis for Orient Electric
While the efficient markets hypothesis continues to be taught by some, it has been proven that markets are over-reactive dynamic systems, and investors are not always rational. By comparing earnings per share (EPS) and share price changes over time, we can get a feel for how investor attitudes to a company have morphed over time.
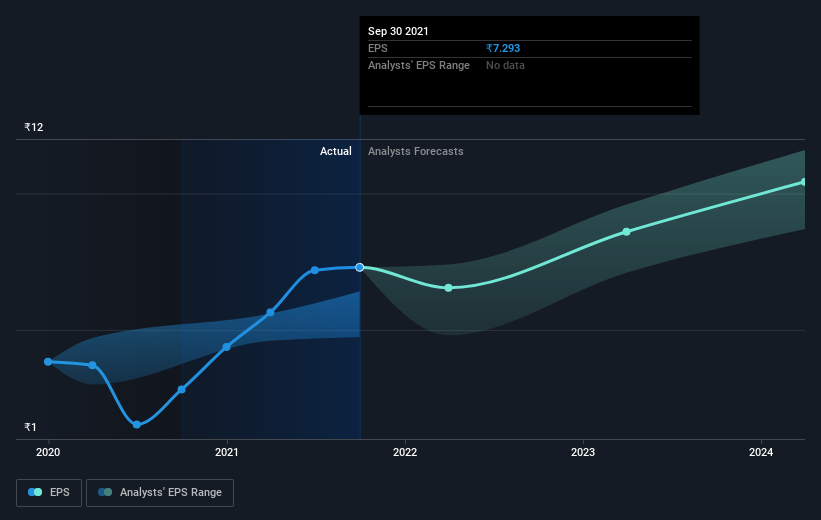
Orient Electric was able to grow its EPS at 26% per year over three years, sending the share price higher. This EPS growth is lower than the 36% average annual increase in the share price. So it's fair to assume the market has a higher opinion of the business than it did three years ago. That's not necessarily surprising considering the three-year track record of earnings growth. This favorable sentiment is reflected in its (fairly optimistic) P/E ratio of 50.37.
The image below shows how EPS has tracked over time (if you click on the image you can see greater detail).
We know that Orient Electric has improved its bottom line lately, but is it going to grow revenue? This free report showing analyst revenue forecasts should help you figure out if the EPS growth can be sustained.
What About Dividends?
As well as measuring the share price return, investors should also consider the total shareholder return (TSR). Whereas the share price return only reflects the change in the share price, the TSR includes the value of dividends (assuming they were reinvested) and the benefit of any discounted capital raising or spin-off. So for companies that pay a generous dividend, the TSR is often a lot higher than the share price return. In the case of Orient Electric, it has a TSR of 157% for the last 3 years. That exceeds its share price return that we previously mentioned. The dividends paid by the company have thusly boosted the total shareholder return.
A Different Perspective
It's nice to see that Orient Electric shareholders have gained 68% (in total) over the last year. That includes the value of the dividend. That gain actually surpasses the 37% TSR it generated (per year) over three years. Given the track record of solid returns over varying time frames, it might be worth putting Orient Electric on your watchlist. I find it very interesting to look at share price over the long term as a proxy for business performance. But to truly gain insight, we need to consider other information, too. Like risks, for instance. Every company has them, and we've spotted 2 warning signs for Orient Electric (of which 1 makes us a bit uncomfortable!) you should know about.
If you like to buy stocks alongside management, then you might just love this free list of companies. (Hint: insiders have been buying them).
Please note, the market returns quoted in this article reflect the market weighted average returns of stocks that currently trade on IN exchanges.
New: AI Stock Screener & Alerts
Our new AI Stock Screener scans the market every day to uncover opportunities.
• Dividend Powerhouses (3%+ Yield)
• Undervalued Small Caps with Insider Buying
• High growth Tech and AI Companies
Or build your own from over 50 metrics.
Have feedback on this article? Concerned about the content? Get in touch with us directly. Alternatively, email editorial-team (at) simplywallst.com.
This article by Simply Wall St is general in nature. We provide commentary based on historical data and analyst forecasts only using an unbiased methodology and our articles are not intended to be financial advice. It does not constitute a recommendation to buy or sell any stock, and does not take account of your objectives, or your financial situation. We aim to bring you long-term focused analysis driven by fundamental data. Note that our analysis may not factor in the latest price-sensitive company announcements or qualitative material. Simply Wall St has no position in any stocks mentioned.
About NSEI:ORIENTELEC
Orient Electric
Manufactures, purchases, and sells electrical consumer durables, and lighting and switchgear products in India and internationally.
Flawless balance sheet with high growth potential.
Market Insights

Community Narratives

