
Advertisement
In the last week, the Indian market has stayed flat, but it is up 45% over the past year with earnings forecast to grow by 17% annually. In such a dynamic environment, selecting dividend stocks that offer both stability and consistent returns can be a prudent strategy for investors.
Top 10 Dividend Stocks In India
| Name | Dividend Yield | Dividend Rating |
| Castrol India (BSE:500870) | 3.03% | ★★★★★★ |
| Balmer Lawrie Investments (BSE:532485) | 3.55% | ★★★★★★ |
| D. B (NSEI:DBCORP) | 5.29% | ★★★★★☆ |
| HCL Technologies (NSEI:HCLTECH) | 3.33% | ★★★★★☆ |
| VST Industries (BSE:509966) | 3.62% | ★★★★★☆ |
| Indian Oil (NSEI:IOC) | 8.21% | ★★★★★☆ |
| Redington (NSEI:REDINGTON) | 3.26% | ★★★★★☆ |
| Canara Bank (NSEI:CANBK) | 3.06% | ★★★★★☆ |
| Bank of Baroda (NSEI:BANKBARODA) | 3.17% | ★★★★★☆ |
| PTC India (NSEI:PTC) | 3.83% | ★★★★★☆ |
Click here to see the full list of 20 stocks from our Top Indian Dividend Stocks screener.
Here we highlight a subset of our preferred stocks from the screener.
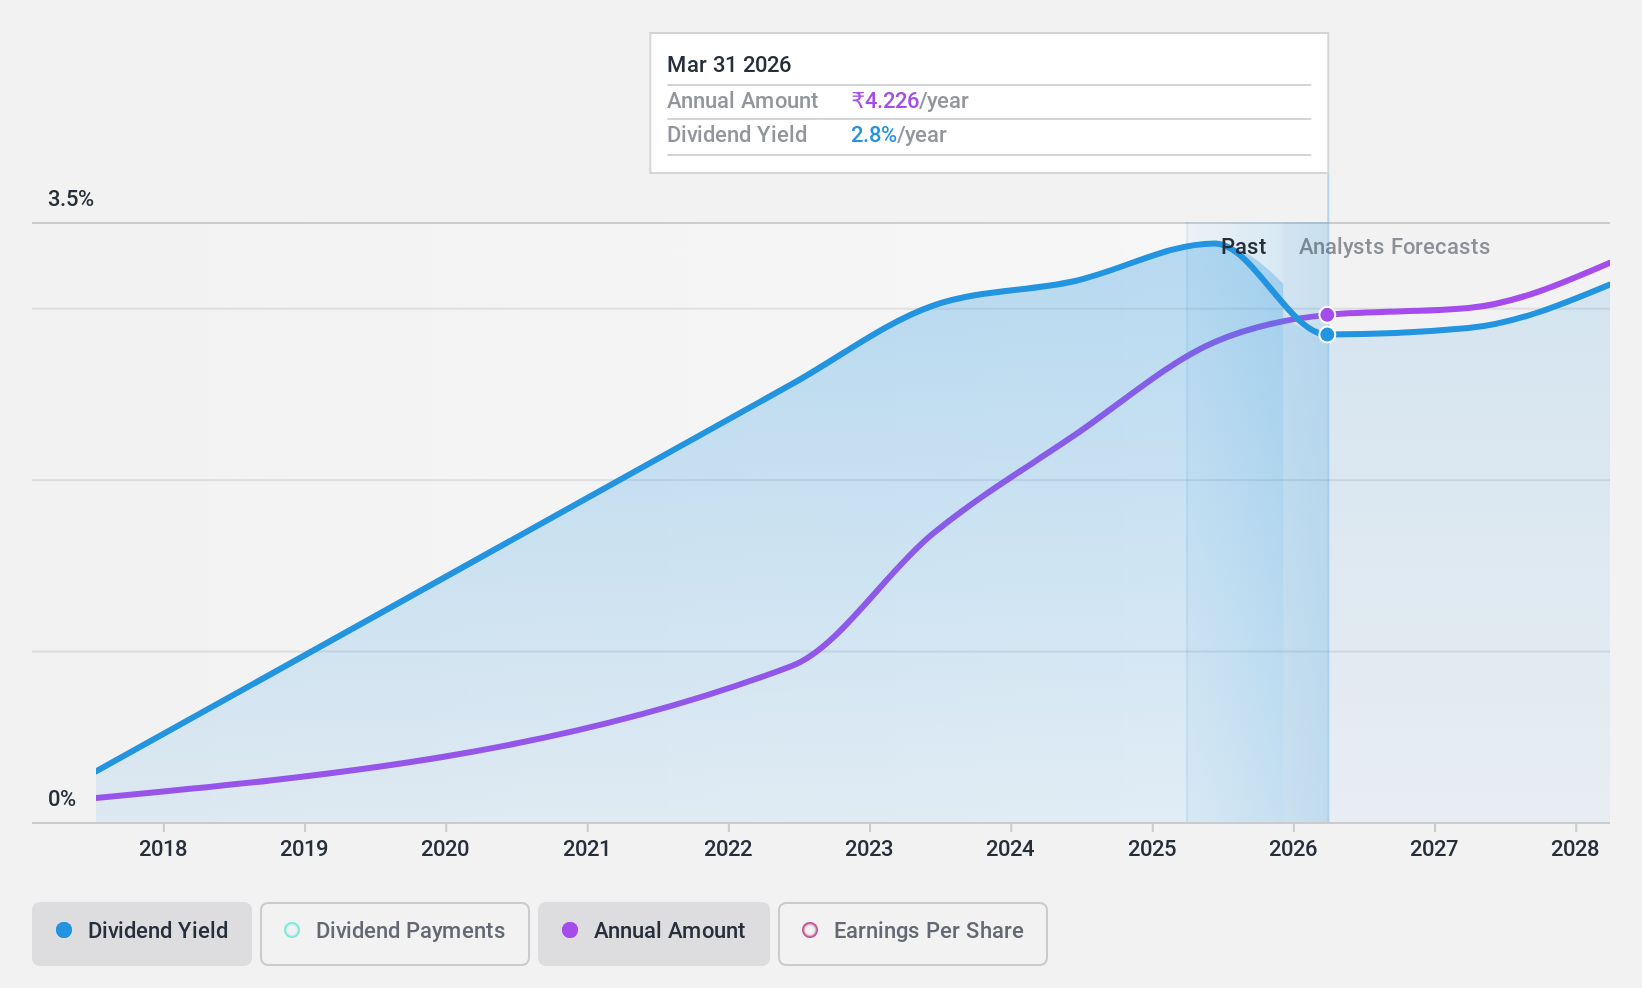
Canara Bank (NSEI:CANBK)
Simply Wall St Dividend Rating: ★★★★★☆
Overview: Canara Bank offers a range of banking products and services both in India and internationally, with a market cap of ₹954.78 billion.
Operations: Canara Bank's revenue segments include Treasury Operations (₹255.75 billion), Life Insurance Operation (₹120.19 billion), Wholesale Banking Operations (₹430.48 billion), Retail Banking Operations - Digital Banking (₹22.30 million), and Other Retail Banking (₹632.28 billion).
Dividend Yield: 3.1%
Canara Bank recently declared a dividend of ₹3.22 per share for FY 2023-24, reflecting a low payout ratio of 19.1%, indicating strong earnings coverage. However, its dividend history has been volatile over the past decade, despite recent increases. The bank's net income for Q1 2024 was ₹40.68 billion, up from ₹37.39 billion YoY, but EPS dropped significantly to ₹4.48 from ₹20.61 YoY due to various factors affecting profitability and operational efficiency changes within the bank's management structure.
- Take a closer look at Canara Bank's potential here in our dividend report.
- Our valuation report here indicates Canara Bank may be undervalued.
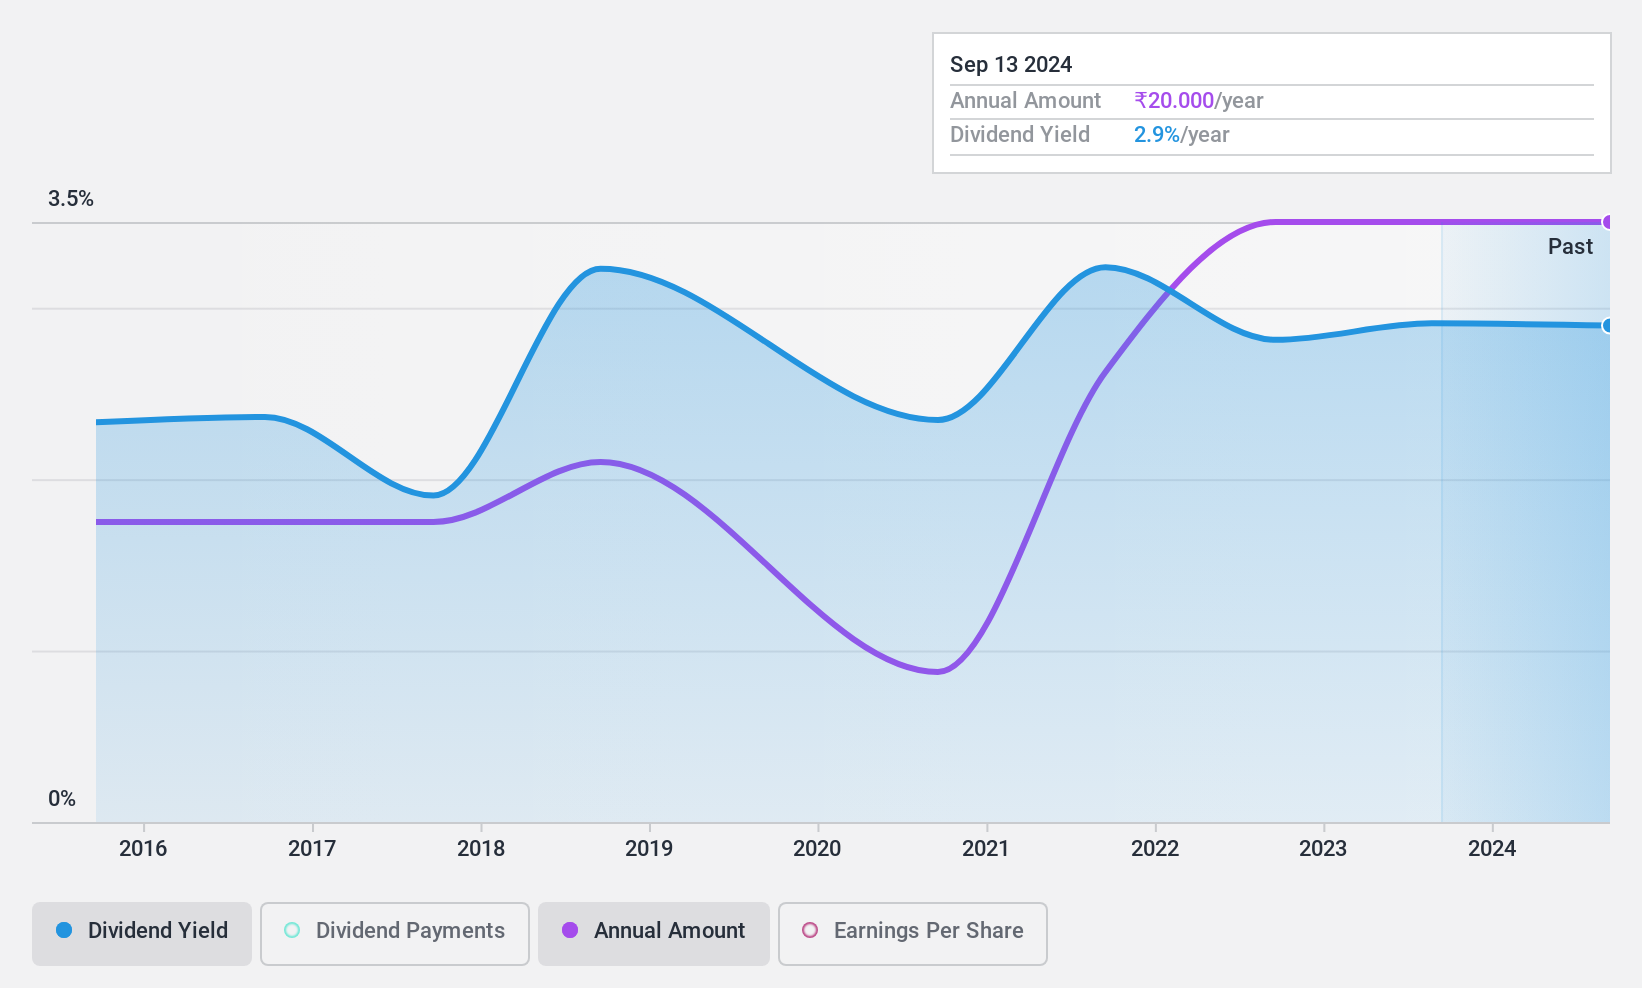
Monte Carlo Fashions (NSEI:MONTECARLO)
Simply Wall St Dividend Rating: ★★★★☆☆
Overview: Monte Carlo Fashions Limited manufactures and trades wool, cotton, cotton blended, knitted, and woven apparel in India and internationally, with a market cap of ₹13.60 billion.
Operations: Monte Carlo Fashions Limited generates revenue primarily from the manufacturing and trading of textile garments, amounting to ₹10.62 billion.
Dividend Yield: 3%
Monte Carlo Fashions' dividend yield of 3.05% places it among the top 25% of Indian dividend payers, though its unstable track record and recent net loss of ₹132.7 million for Q1 2024 raise concerns. The company's payout ratio stands at a reasonable 69.2%, covered by earnings, but cash flow coverage is tighter at 88.8%. Despite increasing dividends over nine years, payments have been volatile and not consistently reliable for investors seeking stable income.
- Click to explore a detailed breakdown of our findings in Monte Carlo Fashions' dividend report.
- The valuation report we've compiled suggests that Monte Carlo Fashions' current price could be inflated.
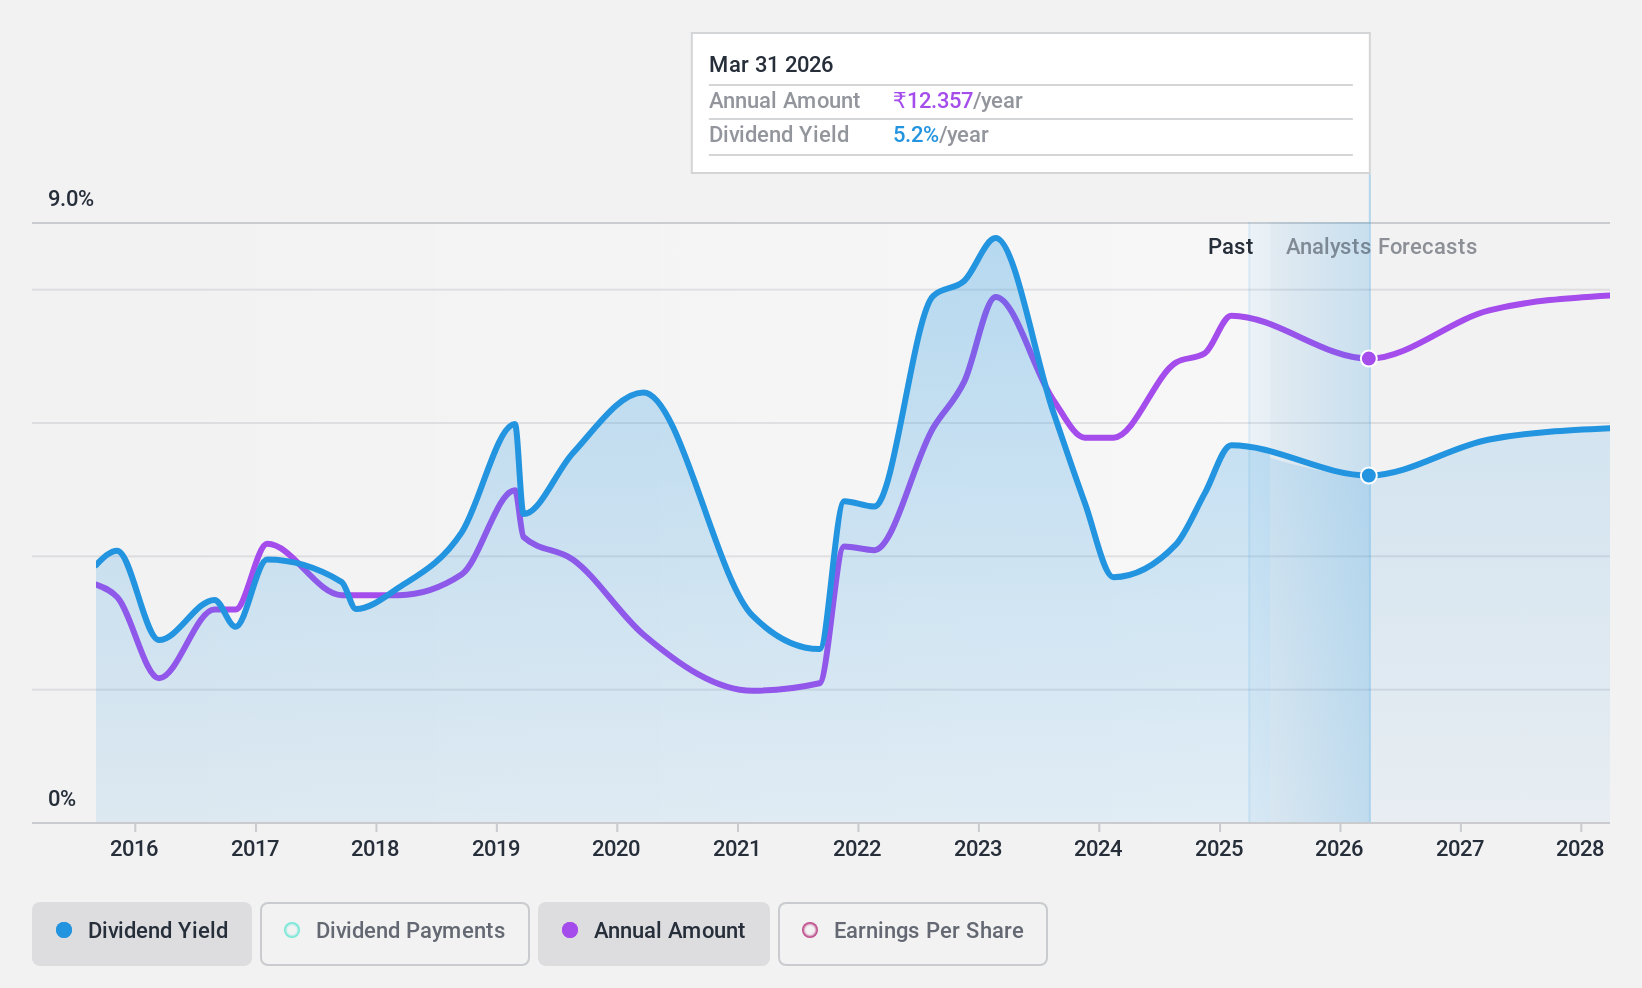
Oil and Natural Gas (NSEI:ONGC)
Simply Wall St Dividend Rating: ★★★★★☆
Overview: Oil and Natural Gas Corporation Limited explores for, develops, and produces crude oil and natural gas in India and internationally, with a market cap of ₹3.90 trillion.
Operations: Oil and Natural Gas Corporation Limited generates revenue from various segments including ₹95.53 billion from outside India, ₹5.67 trillion from refining and marketing within India, ₹438.65 billion from onshore exploration and production in India, and ₹942.70 billion from offshore exploration and production in India.
Dividend Yield: 3.9%
Oil and Natural Gas Corporation Limited (ONGC) offers a dividend yield of 3.95%, placing it in the top 25% of Indian dividend payers. However, its dividends have been volatile over the past decade despite recent increases. The payout ratio is low at 31.3%, indicating earnings cover dividends well, and cash flow coverage is similarly strong at 32.5%. Recent Q1 results show a decline in net income to ₹99.36 billion from ₹146.44 billion year-on-year, impacting overall financial stability for dividend sustainability.
- Get an in-depth perspective on Oil and Natural Gas' performance by reading our dividend report here.
- According our valuation report, there's an indication that Oil and Natural Gas' share price might be on the cheaper side.
Make It Happen
- Delve into our full catalog of 20 Top Indian Dividend Stocks here.
- Already own these companies? Link your portfolio to Simply Wall St and get alerts on any new warning signs to your stocks.
- Invest smarter with the free Simply Wall St app providing detailed insights into every stock market around the globe.
Ready To Venture Into Other Investment Styles?
- Explore high-performing small cap companies that haven't yet garnered significant analyst attention.
- Fuel your portfolio with companies showing strong growth potential, backed by optimistic outlooks both from analysts and management.
- Find companies with promising cash flow potential yet trading below their fair value.
This article by Simply Wall St is general in nature. We provide commentary based on historical data and analyst forecasts only using an unbiased methodology and our articles are not intended to be financial advice. It does not constitute a recommendation to buy or sell any stock, and does not take account of your objectives, or your financial situation. We aim to bring you long-term focused analysis driven by fundamental data. Note that our analysis may not factor in the latest price-sensitive company announcements or qualitative material. Simply Wall St has no position in any stocks mentioned.
New: Manage All Your Stock Portfolios in One Place
We've created the ultimate portfolio companion for stock investors, and it's free.
• Connect an unlimited number of Portfolios and see your total in one currency
• Be alerted to new Warning Signs or Risks via email or mobile
• Track the Fair Value of your stocks
Have feedback on this article? Concerned about the content? Get in touch with us directly. Alternatively, email editorial-team@simplywallst.com
About NSEI:MONTECARLO
Monte Carlo Fashions
Manufactures and trades in woolen, cotton, cotton-blended, knitted, and woven garments for men, women, and kids in India and internationally.
Proven track record with adequate balance sheet and pays a dividend.
Similar Companies
Market Insights

Advertisement
Community Narratives
MicroVision will explode future revenue by 380.37% with a vision towards success
Fair Value US$60|98.4% undervalued
TH
Community Contributor
The Indispensable Artery for a New North American Economy
Fair Value CA$132.87|0.7% overvalued
TI
Community Contributor
Recently Updated Narratives
CO

composite32 on Astor Enerji ·
Astor Enerji will surge with a fair value of $140.43 in the next 3 years
Fair Value:₺140.4335.5% undervalued
1 followerusers have followed this narrative
0 commentsusers have commented on this narrative
0 likesusers have liked this narrative
RE

RecMag on Proximus ·
Proximus: The State-Backed Backup Plan with 7% Gross Yield and 15% Currency Upside.
Fair Value:€17.1356.7% undervalued
29 followersusers have followed this narrative
0 commentsusers have commented on this narrative
0 likesusers have liked this narrative
AG


Agricola on IMPACT Silver ·
A case for for IMPACT Silver Corp (TSXV:IPT) to reach USD $4.52 (CAD $6.16) in 2026 (23 bagger in 1 year) and USD $5.76 (CAD $7.89) by 2030
Fair Value:CA$7.8996.2% undervalued
1 followerusers have followed this narrative
0 commentsusers have commented on this narrative
0 likesusers have liked this narrative
Popular Narratives
TH

TheWallstreetKing on MicroVision ·
MicroVision will explode future revenue by 380.37% with a vision towards success
Fair Value:US$6098.4% undervalued
101 followersusers have followed this narrative
10 commentsusers have commented on this narrative
20 likesusers have liked this narrative
OS


oscargarcia on Alphabet ·
The company that turned a verb into a global necessity and basically runs the modern internet, digital ads, smartphones, maps, and AI.
Fair Value:US$3405.8% undervalued
137 followersusers have followed this narrative
6 commentsusers have commented on this narrative
18 likesusers have liked this narrative
AN


AnalystConsensusTarget on NVIDIA ·
NVDA: Expanding AI Demand Will Drive Major Data Center Investments Through 2026
Fair Value:US$232.7924.0% undervalued
929 followersusers have followed this narrative
6 commentsusers have commented on this narrative
22 likesusers have liked this narrative