
Advertisement
These 4 Measures Indicate That Lux Industries (NSE:LUXIND) Is Using Debt Reasonably Well
David Iben put it well when he said, 'Volatility is not a risk we care about. What we care about is avoiding the permanent loss of capital.' It's only natural to consider a company's balance sheet when you examine how risky it is, since debt is often involved when a business collapses. As with many other companies Lux Industries Limited (NSE:LUXIND) makes use of debt. But the real question is whether this debt is making the company risky.
When Is Debt A Problem?
Debt is a tool to help businesses grow, but if a business is incapable of paying off its lenders, then it exists at their mercy. Part and parcel of capitalism is the process of 'creative destruction' where failed businesses are mercilessly liquidated by their bankers. However, a more common (but still painful) scenario is that it has to raise new equity capital at a low price, thus permanently diluting shareholders. Of course, plenty of companies use debt to fund growth, without any negative consequences. When we think about a company's use of debt, we first look at cash and debt together.
See our latest analysis for Lux Industries
What Is Lux Industries's Debt?
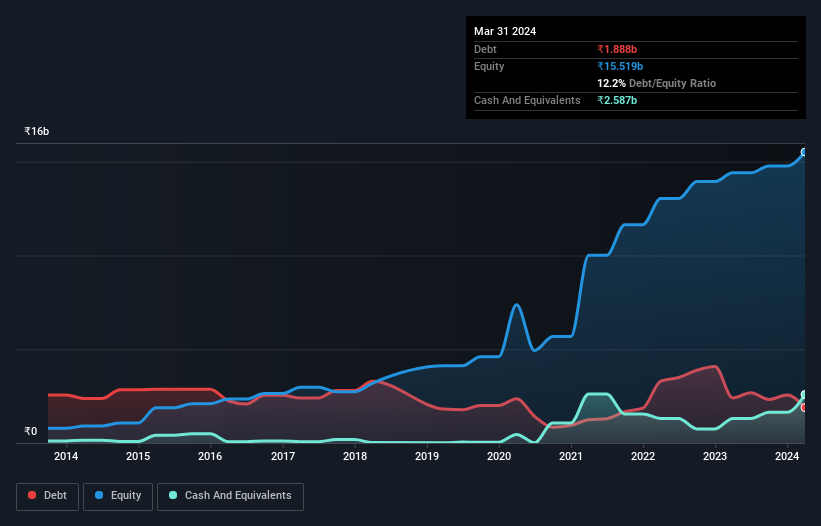
As you can see below, Lux Industries had ₹1.89b of debt at March 2024, down from ₹2.40b a year prior. But it also has ₹2.59b in cash to offset that, meaning it has ₹699.2m net cash.
A Look At Lux Industries' Liabilities
According to the last reported balance sheet, Lux Industries had liabilities of ₹6.02b due within 12 months, and liabilities of ₹355.2m due beyond 12 months. Offsetting this, it had ₹2.59b in cash and ₹7.25b in receivables that were due within 12 months. So it actually has ₹3.46b more liquid assets than total liabilities.
This short term liquidity is a sign that Lux Industries could probably pay off its debt with ease, as its balance sheet is far from stretched. Succinctly put, Lux Industries boasts net cash, so it's fair to say it does not have a heavy debt load!
But the bad news is that Lux Industries has seen its EBIT plunge 12% in the last twelve months. If that rate of decline in earnings continues, the company could find itself in a tight spot. When analysing debt levels, the balance sheet is the obvious place to start. But it is future earnings, more than anything, that will determine Lux Industries's ability to maintain a healthy balance sheet going forward. So if you're focused on the future you can check out this free report showing analyst profit forecasts.
Finally, a business needs free cash flow to pay off debt; accounting profits just don't cut it. Lux Industries may have net cash on the balance sheet, but it is still interesting to look at how well the business converts its earnings before interest and tax (EBIT) to free cash flow, because that will influence both its need for, and its capacity to manage debt. In the last three years, Lux Industries basically broke even on a free cash flow basis. Some might say that's a concern, when it comes considering how easily it would be for it to down debt.
Summing Up
While it is always sensible to investigate a company's debt, in this case Lux Industries has ₹699.2m in net cash and a decent-looking balance sheet. So we are not troubled with Lux Industries's debt use. Above most other metrics, we think its important to track how fast earnings per share is growing, if at all. If you've also come to that realization, you're in luck, because today you can view this interactive graph of Lux Industries's earnings per share history for free.
Of course, if you're the type of investor who prefers buying stocks without the burden of debt, then don't hesitate to discover our exclusive list of net cash growth stocks, today.
New: AI Stock Screener & Alerts
Our new AI Stock Screener scans the market every day to uncover opportunities.
• Dividend Powerhouses (3%+ Yield)
• Undervalued Small Caps with Insider Buying
• High growth Tech and AI Companies
Or build your own from over 50 metrics.
Have feedback on this article? Concerned about the content? Get in touch with us directly. Alternatively, email editorial-team (at) simplywallst.com.
This article by Simply Wall St is general in nature. We provide commentary based on historical data and analyst forecasts only using an unbiased methodology and our articles are not intended to be financial advice. It does not constitute a recommendation to buy or sell any stock, and does not take account of your objectives, or your financial situation. We aim to bring you long-term focused analysis driven by fundamental data. Note that our analysis may not factor in the latest price-sensitive company announcements or qualitative material. Simply Wall St has no position in any stocks mentioned.
Have feedback on this article? Concerned about the content? Get in touch with us directly. Alternatively, email editorial-team@simplywallst.com
About NSEI:LUXIND
Excellent balance sheet with reasonable growth potential.
Similar Companies
Market Insights

Advertisement
Community Narratives
Kodiak AI - a potential 100 bagger opportunity?
Fair Value US$14.00|44.7% undervalued
DA
Community Contributor
A Fair Price for a Great Business Facing Real Threats
Fair Value US$383.06|13.0% undervalued
IM
Community Contributor
AXON And Shopify Integration Will Unlock Global Mobile Advertising
Fair Value US$646.30|7.3% undervalued
AN
Based on Analyst Price Targets