Liberty Shoes Ltd.'s (NSE:LIBERTSHOE) Shares Climb 26% But Its Business Is Yet to Catch Up


Liberty Shoes Ltd. (NSE:LIBERTSHOE) shareholders are no doubt pleased to see that the share price has bounced 26% in the last month, although it is still struggling to make up recently lost ground. Looking further back, the 20% rise over the last twelve months isn't too bad notwithstanding the strength over the last 30 days.
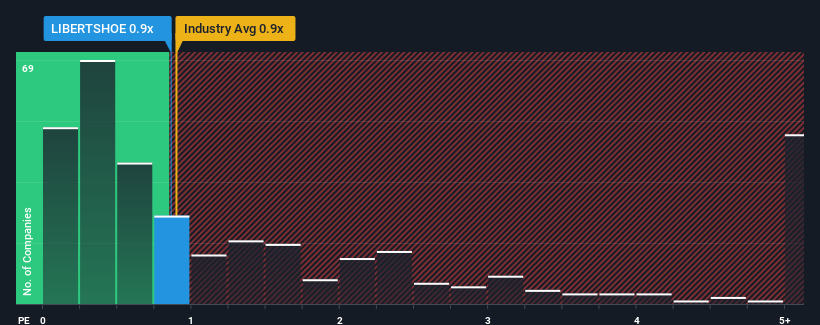
Although its price has surged higher, there still wouldn't be many who think Liberty Shoes' price-to-sales (or "P/S") ratio of 0.9x is worth a mention when it essentially matches the median P/S in India's Luxury industry. While this might not raise any eyebrows, if the P/S ratio is not justified investors could be missing out on a potential opportunity or ignoring looming disappointment.
View our latest analysis for Liberty Shoes
How Liberty Shoes Has Been Performing
Revenue has risen at a steady rate over the last year for Liberty Shoes, which is generally not a bad outcome. Perhaps the expectation moving forward is that the revenue growth will track in line with the wider industry for the near term, which has kept the P/S subdued. If not, then at least existing shareholders probably aren't too pessimistic about the future direction of the share price.
We don't have analyst forecasts, but you can see how recent trends are setting up the company for the future by checking out our free report on Liberty Shoes' earnings, revenue and cash flow.How Is Liberty Shoes' Revenue Growth Trending?
Liberty Shoes' P/S ratio would be typical for a company that's only expected to deliver moderate growth, and importantly, perform in line with the industry.
Retrospectively, the last year delivered a decent 3.0% gain to the company's revenues. Revenue has also lifted 28% in aggregate from three years ago, partly thanks to the last 12 months of growth. Therefore, it's fair to say the revenue growth recently has been respectable for the company.
This is in contrast to the rest of the industry, which is expected to grow by 12% over the next year, materially higher than the company's recent medium-term annualised growth rates.
In light of this, it's curious that Liberty Shoes' P/S sits in line with the majority of other companies. It seems most investors are ignoring the fairly limited recent growth rates and are willing to pay up for exposure to the stock. They may be setting themselves up for future disappointment if the P/S falls to levels more in line with recent growth rates.
The Final Word
Its shares have lifted substantially and now Liberty Shoes' P/S is back within range of the industry median. Using the price-to-sales ratio alone to determine if you should sell your stock isn't sensible, however it can be a practical guide to the company's future prospects.
We've established that Liberty Shoes' average P/S is a bit surprising since its recent three-year growth is lower than the wider industry forecast. When we see weak revenue with slower than industry growth, we suspect the share price is at risk of declining, bringing the P/S back in line with expectations. Unless there is a significant improvement in the company's medium-term performance, it will be difficult to prevent the P/S ratio from declining to a more reasonable level.
It's always necessary to consider the ever-present spectre of investment risk. We've identified 5 warning signs with Liberty Shoes (at least 1 which is a bit concerning), and understanding these should be part of your investment process.
It's important to make sure you look for a great company, not just the first idea you come across. So if growing profitability aligns with your idea of a great company, take a peek at this free list of interesting companies with strong recent earnings growth (and a low P/E).
If you're looking to trade Liberty Shoes, open an account with the lowest-cost platform trusted by professionals, Interactive Brokers.
With clients in over 200 countries and territories, and access to 160 markets, IBKR lets you trade stocks, options, futures, forex, bonds and funds from a single integrated account.
Enjoy no hidden fees, no account minimums, and FX conversion rates as low as 0.03%, far better than what most brokers offer.
Sponsored ContentNew: AI Stock Screener & Alerts
Our new AI Stock Screener scans the market every day to uncover opportunities.
• Dividend Powerhouses (3%+ Yield)
• Undervalued Small Caps with Insider Buying
• High growth Tech and AI Companies
Or build your own from over 50 metrics.
Have feedback on this article? Concerned about the content? Get in touch with us directly. Alternatively, email editorial-team (at) simplywallst.com.
This article by Simply Wall St is general in nature. We provide commentary based on historical data and analyst forecasts only using an unbiased methodology and our articles are not intended to be financial advice. It does not constitute a recommendation to buy or sell any stock, and does not take account of your objectives, or your financial situation. We aim to bring you long-term focused analysis driven by fundamental data. Note that our analysis may not factor in the latest price-sensitive company announcements or qualitative material. Simply Wall St has no position in any stocks mentioned.
About NSEI:LIBERTSHOE
Liberty Shoes
Manufactures and trades in footwear, accessories, and lifestyle products in India and internationally.
Excellent balance sheet with proven track record.
Similar Companies
Market Insights

Community Narratives

