Does K.P.R. Mill's (NSE:KPRMILL) Statutory Profit Adequately Reflect Its Underlying Profit?


Many investors consider it preferable to invest in profitable companies over unprofitable ones, because profitability suggests a business is sustainable. That said, the current statutory profit is not always a good guide to a company's underlying profitability. In this article, we'll look at how useful this year's statutory profit is, when analysing K.P.R. Mill (NSE:KPRMILL).
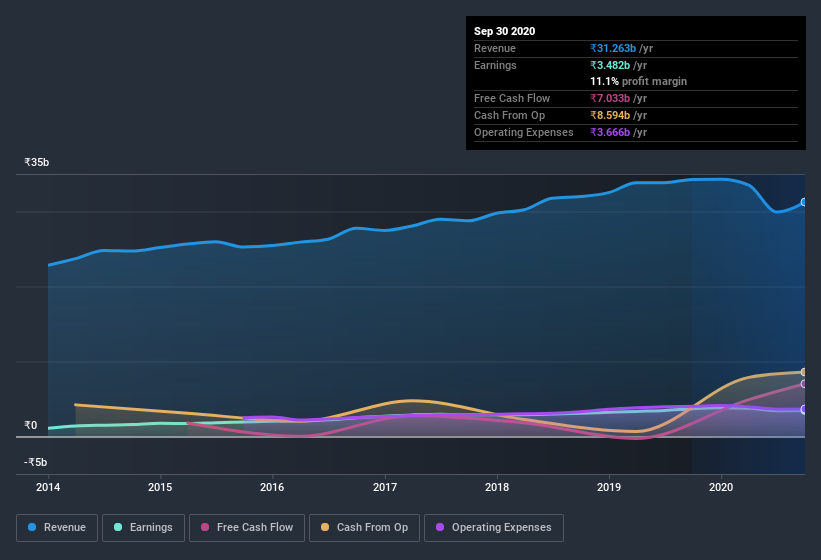
We like the fact that K.P.R. Mill made a profit of ₹3.48b on its revenue of ₹31.3b, in the last year. In the chart below, you can see that its profit and revenue have both grown over the last three years, albeit not in the last year.
Check out our latest analysis for K.P.R. Mill
Not all profits are equal, and we can learn more about the nature of a company's past profitability by diving deeper into the financial statements. Today, we'll discuss K.P.R. Mill's free cashflow relative to its earnings, and consider what that tells us about the company. That might leave you wondering what analysts are forecasting in terms of future profitability. Luckily, you can click here to see an interactive graph depicting future profitability, based on their estimates.
Examining Cashflow Against K.P.R. Mill's Earnings
One key financial ratio used to measure how well a company converts its profit to free cash flow (FCF) is the accrual ratio. In plain english, this ratio subtracts FCF from net profit, and divides that number by the company's average operating assets over that period. The ratio shows us how much a company's profit exceeds its FCF.
As a result, a negative accrual ratio is a positive for the company, and a positive accrual ratio is a negative. That is not intended to imply we should worry about a positive accrual ratio, but it's worth noting where the accrual ratio is rather high. That's because some academic studies have suggested that high accruals ratios tend to lead to lower profit or less profit growth.
For the year to September 2020, K.P.R. Mill had an accrual ratio of -0.16. That indicates that its free cash flow quite significantly exceeded its statutory profit. In fact, it had free cash flow of ₹7.0b in the last year, which was a lot more than its statutory profit of ₹3.48b. K.P.R. Mill's free cash flow improved over the last year, which is generally good to see.
Our Take On K.P.R. Mill's Profit Performance
As we discussed above, K.P.R. Mill has perfectly satisfactory free cash flow relative to profit. Because of this, we think K.P.R. Mill's earnings potential is at least as good as it seems, and maybe even better! And the EPS is up 29% annually, over the last three years. At the end of the day, it's essential to consider more than just the factors above, if you want to understand the company properly. Keep in mind, when it comes to analysing a stock it's worth noting the risks involved. You'd be interested to know, that we found 2 warning signs for K.P.R. Mill and you'll want to know about them.
This note has only looked at a single factor that sheds light on the nature of K.P.R. Mill's profit. But there are plenty of other ways to inform your opinion of a company. Some people consider a high return on equity to be a good sign of a quality business. While it might take a little research on your behalf, you may find this free collection of companies boasting high return on equity, or this list of stocks that insiders are buying to be useful.
When trading K.P.R. Mill or any other investment, use the platform considered by many to be the Professional's Gateway to the Worlds Market, Interactive Brokers. You get the lowest-cost* trading on stocks, options, futures, forex, bonds and funds worldwide from a single integrated account. Promoted
Valuation is complex, but we're here to simplify it.
Discover if K.P.R. Mill might be undervalued or overvalued with our detailed analysis, featuring fair value estimates, potential risks, dividends, insider trades, and its financial condition.
Access Free AnalysisThis article by Simply Wall St is general in nature. It does not constitute a recommendation to buy or sell any stock, and does not take account of your objectives, or your financial situation. We aim to bring you long-term focused analysis driven by fundamental data. Note that our analysis may not factor in the latest price-sensitive company announcements or qualitative material. Simply Wall St has no position in any stocks mentioned.
*Interactive Brokers Rated Lowest Cost Broker by StockBrokers.com Annual Online Review 2020
Have feedback on this article? Concerned about the content? Get in touch with us directly. Alternatively, email editorial-team@simplywallst.com.
About NSEI:KPRMILL
K.P.R. Mill
Operates as an integrated apparel manufacturing company in India and internationally.
Flawless balance sheet average dividend payer.

