
Advertisement
Some Kanani Industries Limited (NSE:KANANIIND) Shareholders Look For Exit As Shares Take 36% Pounding

Kanani Industries Limited (NSE:KANANIIND) shares have retraced a considerable 36% in the last month, reversing a fair amount of their solid recent performance. Longer-term, the stock has been solid despite a difficult 30 days, gaining 22% in the last year.
Even after such a large drop in price, it's still not a stretch to say that Kanani Industries' price-to-sales (or "P/S") ratio of 0.4x right now seems quite "middle-of-the-road" compared to the Luxury industry in India, where the median P/S ratio is around 0.9x. While this might not raise any eyebrows, if the P/S ratio is not justified investors could be missing out on a potential opportunity or ignoring looming disappointment.
See our latest analysis for Kanani Industries
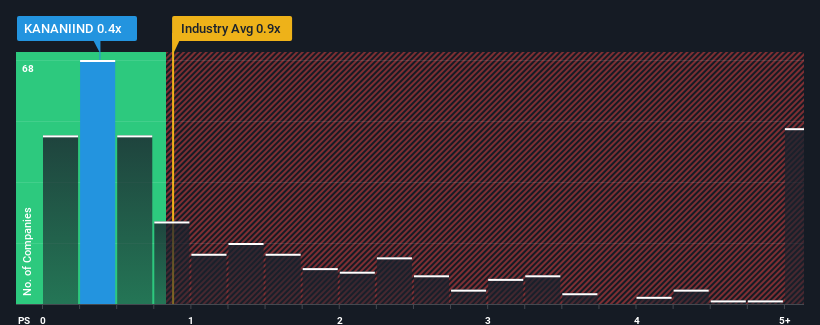
What Does Kanani Industries' P/S Mean For Shareholders?
For instance, Kanani Industries' receding revenue in recent times would have to be some food for thought. Perhaps investors believe the recent revenue performance is enough to keep in line with the industry, which is keeping the P/S from dropping off. If you like the company, you'd at least be hoping this is the case so that you could potentially pick up some stock while it's not quite in favour.
Want the full picture on earnings, revenue and cash flow for the company? Then our free report on Kanani Industries will help you shine a light on its historical performance.Is There Some Revenue Growth Forecasted For Kanani Industries?
There's an inherent assumption that a company should be matching the industry for P/S ratios like Kanani Industries' to be considered reasonable.
In reviewing the last year of financials, we were disheartened to see the company's revenues fell to the tune of 7.8%. As a result, revenue from three years ago have also fallen 29% overall. So unfortunately, we have to acknowledge that the company has not done a great job of growing revenue over that time.
In contrast to the company, the rest of the industry is expected to grow by 12% over the next year, which really puts the company's recent medium-term revenue decline into perspective.
With this information, we find it concerning that Kanani Industries is trading at a fairly similar P/S compared to the industry. It seems most investors are ignoring the recent poor growth rate and are hoping for a turnaround in the company's business prospects. Only the boldest would assume these prices are sustainable as a continuation of recent revenue trends is likely to weigh on the share price eventually.
What Does Kanani Industries' P/S Mean For Investors?
With its share price dropping off a cliff, the P/S for Kanani Industries looks to be in line with the rest of the Luxury industry. It's argued the price-to-sales ratio is an inferior measure of value within certain industries, but it can be a powerful business sentiment indicator.
We find it unexpected that Kanani Industries trades at a P/S ratio that is comparable to the rest of the industry, despite experiencing declining revenues during the medium-term, while the industry as a whole is expected to grow. Even though it matches the industry, we're uncomfortable with the current P/S ratio, as this dismal revenue performance is unlikely to support a more positive sentiment for long. Unless the recent medium-term conditions improve markedly, investors will have a hard time accepting the share price as fair value.
Having said that, be aware Kanani Industries is showing 4 warning signs in our investment analysis, you should know about.
If these risks are making you reconsider your opinion on Kanani Industries, explore our interactive list of high quality stocks to get an idea of what else is out there.
Valuation is complex, but we're here to simplify it.
Discover if Kanani Industries might be undervalued or overvalued with our detailed analysis, featuring fair value estimates, potential risks, dividends, insider trades, and its financial condition.
Access Free AnalysisHave feedback on this article? Concerned about the content? Get in touch with us directly. Alternatively, email editorial-team (at) simplywallst.com.
This article by Simply Wall St is general in nature. We provide commentary based on historical data and analyst forecasts only using an unbiased methodology and our articles are not intended to be financial advice. It does not constitute a recommendation to buy or sell any stock, and does not take account of your objectives, or your financial situation. We aim to bring you long-term focused analysis driven by fundamental data. Note that our analysis may not factor in the latest price-sensitive company announcements or qualitative material. Simply Wall St has no position in any stocks mentioned.
About NSEI:KANANIIND
Kanani Industries
Engages in the manufacture and export of diamond studded jewellery in India.
Flawless balance sheet with proven track record.
Similar Companies
Market Insights

Advertisement
Community Narratives
WhiteCap Is Positioned To Profit Regardless Of Trump's Policy 
Fair Value CA$22.60|61.6% undervalued
ST
Equity Analyst and Writer
Microsoft's Evolution Will Drive Revenue to New Heights Fueled by AI
Fair Value US$360.00|28.3% overvalued
BR
Community Contributor
A CASE FOR USD$2.50 (CAD$3.44) BY 2028 (A 5-10 BAGGER)
Fair Value CA$3.44|87.8% undervalued
AG
Community Contributor