
Advertisement
Is Indo Rama Synthetics (India) (NSE:INDORAMA) Weighed On By Its Debt Load?

Some say volatility, rather than debt, is the best way to think about risk as an investor, but Warren Buffett famously said that 'Volatility is far from synonymous with risk.' So it might be obvious that you need to consider debt, when you think about how risky any given stock is, because too much debt can sink a company. We note that Indo Rama Synthetics (India) Limited (NSE:INDORAMA) does have debt on its balance sheet. But is this debt a concern to shareholders?
Why Does Debt Bring Risk?
Debt is a tool to help businesses grow, but if a business is incapable of paying off its lenders, then it exists at their mercy. In the worst case scenario, a company can go bankrupt if it cannot pay its creditors. While that is not too common, we often do see indebted companies permanently diluting shareholders because lenders force them to raise capital at a distressed price. Of course, plenty of companies use debt to fund growth, without any negative consequences. When we examine debt levels, we first consider both cash and debt levels, together.
See our latest analysis for Indo Rama Synthetics (India)
How Much Debt Does Indo Rama Synthetics (India) Carry?
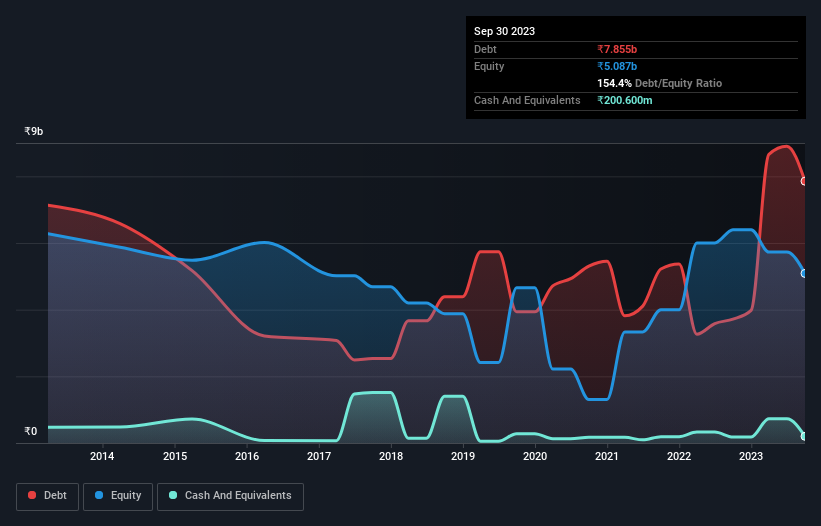
As you can see below, at the end of September 2023, Indo Rama Synthetics (India) had ₹7.85b of debt, up from ₹3.72b a year ago. Click the image for more detail. However, it does have ₹200.6m in cash offsetting this, leading to net debt of about ₹7.65b.
How Strong Is Indo Rama Synthetics (India)'s Balance Sheet?
We can see from the most recent balance sheet that Indo Rama Synthetics (India) had liabilities of ₹18.3b falling due within a year, and liabilities of ₹4.55b due beyond that. Offsetting these obligations, it had cash of ₹200.6m as well as receivables valued at ₹1.69b due within 12 months. So it has liabilities totalling ₹21.0b more than its cash and near-term receivables, combined.
Given this deficit is actually higher than the company's market capitalization of ₹15.1b, we think shareholders really should watch Indo Rama Synthetics (India)'s debt levels, like a parent watching their child ride a bike for the first time. In the scenario where the company had to clean up its balance sheet quickly, it seems likely shareholders would suffer extensive dilution. There's no doubt that we learn most about debt from the balance sheet. But it is Indo Rama Synthetics (India)'s earnings that will influence how the balance sheet holds up in the future. So if you're keen to discover more about its earnings, it might be worth checking out this graph of its long term earnings trend.
Over 12 months, Indo Rama Synthetics (India) made a loss at the EBIT level, and saw its revenue drop to ₹38b, which is a fall of 19%. We would much prefer see growth.
Caveat Emptor
While Indo Rama Synthetics (India)'s falling revenue is about as heartwarming as a wet blanket, arguably its earnings before interest and tax (EBIT) loss is even less appealing. Indeed, it lost ₹478m at the EBIT level. Considering that alongside the liabilities mentioned above make us nervous about the company. It would need to improve its operations quickly for us to be interested in it. Not least because it had negative free cash flow of ₹3.4b over the last twelve months. That means it's on the risky side of things. For riskier companies like Indo Rama Synthetics (India) I always like to keep an eye on the long term profit and revenue trends. Fortunately, you can click to see our interactive graph of its profit, revenue, and operating cashflow.
Of course, if you're the type of investor who prefers buying stocks without the burden of debt, then don't hesitate to discover our exclusive list of net cash growth stocks, today.
New: AI Stock Screener & Alerts
Our new AI Stock Screener scans the market every day to uncover opportunities.
• Dividend Powerhouses (3%+ Yield)
• Undervalued Small Caps with Insider Buying
• High growth Tech and AI Companies
Or build your own from over 50 metrics.
Have feedback on this article? Concerned about the content? Get in touch with us directly. Alternatively, email editorial-team (at) simplywallst.com.
This article by Simply Wall St is general in nature. We provide commentary based on historical data and analyst forecasts only using an unbiased methodology and our articles are not intended to be financial advice. It does not constitute a recommendation to buy or sell any stock, and does not take account of your objectives, or your financial situation. We aim to bring you long-term focused analysis driven by fundamental data. Note that our analysis may not factor in the latest price-sensitive company announcements or qualitative material. Simply Wall St has no position in any stocks mentioned.
About NSEI:INDORAMA
Indo Rama Synthetics (India)
Manufactures and trades polyester products in India, Turkey, Nepal, and internationally.
Good value low.
Similar Companies
Market Insights


Advertisement
Community Narratives
For the Emperor: Why Games Workshop Could Be a Star Investment
Fair Value UK£160.00|0.4% overvalued
RO
Community Contributor
Securitas will boost margins with AI and tech-driven services
Fair Value SEK 260.91|44.5% undervalued
UN
Community Contributor
A Leader in EV Charging with Growth Potential
Fair Value €27.00|17.8% undervalued
TI
Community Contributor