- India
- /
- Consumer Durables
- /
- NSEI:DIXON
A Look Into Dixon Technologies (India)'s (NSE:DIXON) Impressive Returns On Capital


What trends should we look for it we want to identify stocks that can multiply in value over the long term? Firstly, we'd want to identify a growing return on capital employed (ROCE) and then alongside that, an ever-increasing base of capital employed. Put simply, these types of businesses are compounding machines, meaning they are continually reinvesting their earnings at ever-higher rates of return. With that in mind, the ROCE of Dixon Technologies (India) (NSE:DIXON) looks attractive right now, so lets see what the trend of returns can tell us.
Understanding Return On Capital Employed (ROCE)
If you haven't worked with ROCE before, it measures the 'return' (pre-tax profit) a company generates from capital employed in its business. The formula for this calculation on Dixon Technologies (India) is:
Return on Capital Employed = Earnings Before Interest and Tax (EBIT) ÷ (Total Assets - Current Liabilities)
0.27 = ₹2.7b ÷ (₹28b - ₹19b) (Based on the trailing twelve months to June 2021).
So, Dixon Technologies (India) has an ROCE of 27%. That's a fantastic return and not only that, it outpaces the average of 14% earned by companies in a similar industry.
View our latest analysis for Dixon Technologies (India)
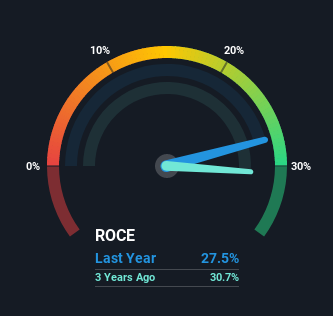
Above you can see how the current ROCE for Dixon Technologies (India) compares to its prior returns on capital, but there's only so much you can tell from the past. If you'd like, you can check out the forecasts from the analysts covering Dixon Technologies (India) here for free.
What Can We Tell From Dixon Technologies (India)'s ROCE Trend?
In terms of Dixon Technologies (India)'s history of ROCE, it's quite impressive. Over the past five years, ROCE has remained relatively flat at around 27% and the business has deployed 431% more capital into its operations. Now considering ROCE is an attractive 27%, this combination is actually pretty appealing because it means the business can consistently put money to work and generate these high returns. If Dixon Technologies (India) can keep this up, we'd be very optimistic about its future.
On a separate but related note, it's important to know that Dixon Technologies (India) has a current liabilities to total assets ratio of 66%, which we'd consider pretty high. This effectively means that suppliers (or short-term creditors) are funding a large portion of the business, so just be aware that this can introduce some elements of risk. While it's not necessarily a bad thing, it can be beneficial if this ratio is lower.
What We Can Learn From Dixon Technologies (India)'s ROCE
In summary, we're delighted to see that Dixon Technologies (India) has been compounding returns by reinvesting at consistently high rates of return, as these are common traits of a multi-bagger. On top of that, the stock has rewarded shareholders with a remarkable 665% return to those who've held over the last three years. So while the positive underlying trends may be accounted for by investors, we still think this stock is worth looking into further.
One more thing to note, we've identified 1 warning sign with Dixon Technologies (India) and understanding it should be part of your investment process.
If you want to search for more stocks that have been earning high returns, check out this free list of stocks with solid balance sheets that are also earning high returns on equity.
If you decide to trade Dixon Technologies (India), use the lowest-cost* platform that is rated #1 Overall by Barron’s, Interactive Brokers. Trade stocks, options, futures, forex, bonds and funds on 135 markets, all from a single integrated account. Promoted
New: Manage All Your Stock Portfolios in One Place
We've created the ultimate portfolio companion for stock investors, and it's free.
• Connect an unlimited number of Portfolios and see your total in one currency
• Be alerted to new Warning Signs or Risks via email or mobile
• Track the Fair Value of your stocks
This article by Simply Wall St is general in nature. We provide commentary based on historical data and analyst forecasts only using an unbiased methodology and our articles are not intended to be financial advice. It does not constitute a recommendation to buy or sell any stock, and does not take account of your objectives, or your financial situation. We aim to bring you long-term focused analysis driven by fundamental data. Note that our analysis may not factor in the latest price-sensitive company announcements or qualitative material. Simply Wall St has no position in any stocks mentioned.
*Interactive Brokers Rated Lowest Cost Broker by StockBrokers.com Annual Online Review 2020
Have feedback on this article? Concerned about the content? Get in touch with us directly. Alternatively, email editorial-team (at) simplywallst.com.
About NSEI:DIXON
Dixon Technologies (India)
Engages in the provision of electronic manufacturing services in India and internationally.
Exceptional growth potential with solid track record.
Similar Companies
Market Insights

Community Narratives

