- India
- /
- Professional Services
- /
- NSEI:TEAMLEASE
We Think TeamLease Services (NSE:TEAMLEASE) Can Stay On Top Of Its Debt


Howard Marks put it nicely when he said that, rather than worrying about share price volatility, 'The possibility of permanent loss is the risk I worry about... and every practical investor I know worries about.' When we think about how risky a company is, we always like to look at its use of debt, since debt overload can lead to ruin. We note that TeamLease Services Limited (NSE:TEAMLEASE) does have debt on its balance sheet. But the more important question is: how much risk is that debt creating?
When Is Debt A Problem?
Debt assists a business until the business has trouble paying it off, either with new capital or with free cash flow. Part and parcel of capitalism is the process of 'creative destruction' where failed businesses are mercilessly liquidated by their bankers. However, a more frequent (but still costly) occurrence is where a company must issue shares at bargain-basement prices, permanently diluting shareholders, just to shore up its balance sheet. Of course, debt can be an important tool in businesses, particularly capital heavy businesses. When we think about a company's use of debt, we first look at cash and debt together.
Check out our latest analysis for TeamLease Services
How Much Debt Does TeamLease Services Carry?
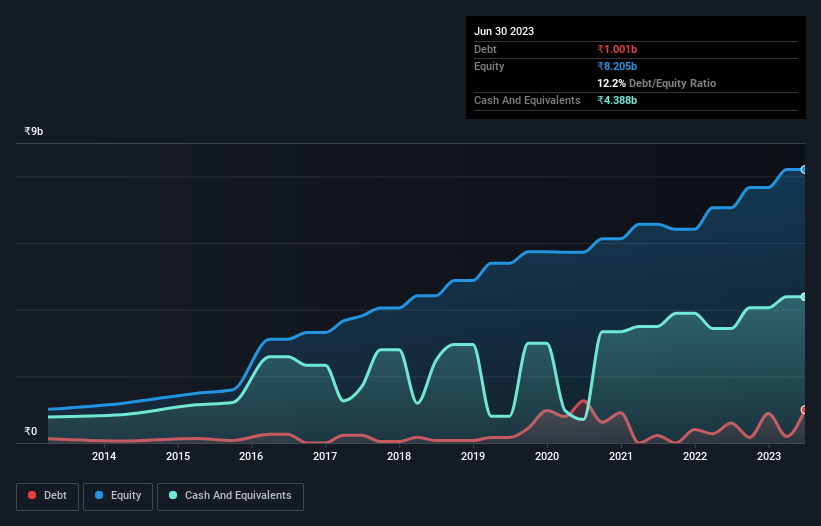
The image below, which you can click on for greater detail, shows that at March 2023 TeamLease Services had debt of ₹1.00b, up from ₹598.3m in one year. But on the other hand it also has ₹4.39b in cash, leading to a ₹3.39b net cash position.
How Strong Is TeamLease Services' Balance Sheet?
Zooming in on the latest balance sheet data, we can see that TeamLease Services had liabilities of ₹7.57b due within 12 months and liabilities of ₹1.91b due beyond that. Offsetting this, it had ₹4.39b in cash and ₹5.53b in receivables that were due within 12 months. So it can boast ₹445.3m more liquid assets than total liabilities.
This state of affairs indicates that TeamLease Services' balance sheet looks quite solid, as its total liabilities are just about equal to its liquid assets. So while it's hard to imagine that the ₹44.4b company is struggling for cash, we still think it's worth monitoring its balance sheet. Succinctly put, TeamLease Services boasts net cash, so it's fair to say it does not have a heavy debt load!
In fact TeamLease Services's saving grace is its low debt levels, because its EBIT has tanked 21% in the last twelve months. Falling earnings (if the trend continues) could eventually make even modest debt quite risky. When analysing debt levels, the balance sheet is the obvious place to start. But ultimately the future profitability of the business will decide if TeamLease Services can strengthen its balance sheet over time. So if you're focused on the future you can check out this free report showing analyst profit forecasts.
Finally, a business needs free cash flow to pay off debt; accounting profits just don't cut it. While TeamLease Services has net cash on its balance sheet, it's still worth taking a look at its ability to convert earnings before interest and tax (EBIT) to free cash flow, to help us understand how quickly it is building (or eroding) that cash balance. Happily for any shareholders, TeamLease Services actually produced more free cash flow than EBIT over the last three years. That sort of strong cash conversion gets us as excited as the crowd when the beat drops at a Daft Punk concert.
Summing Up
While it is always sensible to investigate a company's debt, in this case TeamLease Services has ₹3.39b in net cash and a decent-looking balance sheet. The cherry on top was that in converted 156% of that EBIT to free cash flow, bringing in ₹1.1b. So we are not troubled with TeamLease Services's debt use. Above most other metrics, we think its important to track how fast earnings per share is growing, if at all. If you've also come to that realization, you're in luck, because today you can view this interactive graph of TeamLease Services's earnings per share history for free.
Of course, if you're the type of investor who prefers buying stocks without the burden of debt, then don't hesitate to discover our exclusive list of net cash growth stocks, today.
Valuation is complex, but we're here to simplify it.
Discover if TeamLease Services might be undervalued or overvalued with our detailed analysis, featuring fair value estimates, potential risks, dividends, insider trades, and its financial condition.
Access Free AnalysisHave feedback on this article? Concerned about the content? Get in touch with us directly. Alternatively, email editorial-team (at) simplywallst.com.
This article by Simply Wall St is general in nature. We provide commentary based on historical data and analyst forecasts only using an unbiased methodology and our articles are not intended to be financial advice. It does not constitute a recommendation to buy or sell any stock, and does not take account of your objectives, or your financial situation. We aim to bring you long-term focused analysis driven by fundamental data. Note that our analysis may not factor in the latest price-sensitive company announcements or qualitative material. Simply Wall St has no position in any stocks mentioned.
About NSEI:TEAMLEASE
TeamLease Services
Engages in human resource services to various industries in India and internationally.
Flawless balance sheet with reasonable growth potential.
