

Some say volatility, rather than debt, is the best way to think about risk as an investor, but Warren Buffett famously said that 'Volatility is far from synonymous with risk.' It's only natural to consider a company's balance sheet when you examine how risky it is, since debt is often involved when a business collapses. We note that L&T Technology Services Limited (NSE:LTTS) does have debt on its balance sheet. But the more important question is: how much risk is that debt creating?
When Is Debt Dangerous?
Debt assists a business until the business has trouble paying it off, either with new capital or with free cash flow. Ultimately, if the company can't fulfill its legal obligations to repay debt, shareholders could walk away with nothing. However, a more usual (but still expensive) situation is where a company must dilute shareholders at a cheap share price simply to get debt under control. Of course, plenty of companies use debt to fund growth, without any negative consequences. The first step when considering a company's debt levels is to consider its cash and debt together.
See our latest analysis for L&T Technology Services
What Is L&T Technology Services's Net Debt?
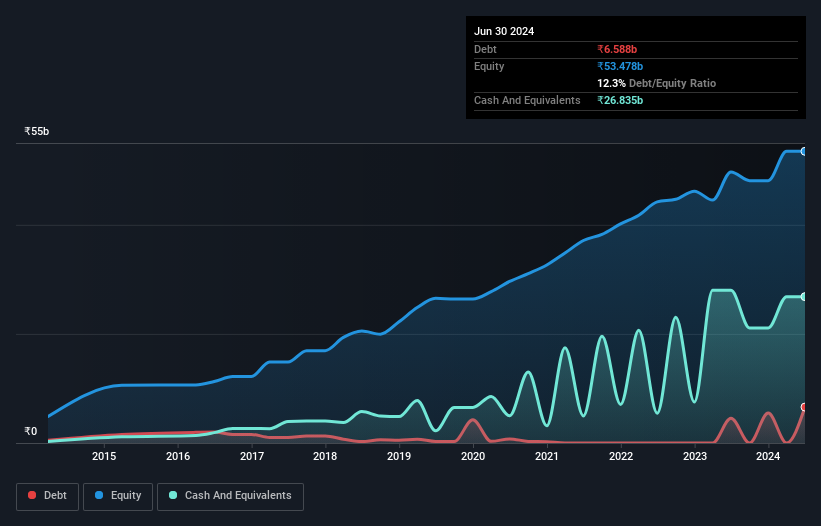
You can click the graphic below for the historical numbers, but it shows that as of March 2024 L&T Technology Services had ₹6.59b of debt, an increase on ₹4.54b, over one year. But it also has ₹26.8b in cash to offset that, meaning it has ₹20.2b net cash.
A Look At L&T Technology Services' Liabilities
The latest balance sheet data shows that L&T Technology Services had liabilities of ₹25.4b due within a year, and liabilities of ₹6.04b falling due after that. On the other hand, it had cash of ₹26.8b and ₹33.2b worth of receivables due within a year. So it can boast ₹28.6b more liquid assets than total liabilities.
This surplus suggests that L&T Technology Services has a conservative balance sheet, and could probably eliminate its debt without much difficulty. Simply put, the fact that L&T Technology Services has more cash than debt is arguably a good indication that it can manage its debt safely.
Fortunately, L&T Technology Services grew its EBIT by 7.0% in the last year, making that debt load look even more manageable. When analysing debt levels, the balance sheet is the obvious place to start. But it is future earnings, more than anything, that will determine L&T Technology Services's ability to maintain a healthy balance sheet going forward. So if you're focused on the future you can check out this free report showing analyst profit forecasts.
But our final consideration is also important, because a company cannot pay debt with paper profits; it needs cold hard cash. L&T Technology Services may have net cash on the balance sheet, but it is still interesting to look at how well the business converts its earnings before interest and tax (EBIT) to free cash flow, because that will influence both its need for, and its capacity to manage debt. Over the most recent three years, L&T Technology Services recorded free cash flow worth 74% of its EBIT, which is around normal, given free cash flow excludes interest and tax. This cold hard cash means it can reduce its debt when it wants to.
Summing Up
While it is always sensible to investigate a company's debt, in this case L&T Technology Services has ₹20.2b in net cash and a decent-looking balance sheet. The cherry on top was that in converted 74% of that EBIT to free cash flow, bringing in ₹12b. So is L&T Technology Services's debt a risk? It doesn't seem so to us. When analysing debt levels, the balance sheet is the obvious place to start. However, not all investment risk resides within the balance sheet - far from it. We've identified 2 warning signs with L&T Technology Services , and understanding them should be part of your investment process.
If, after all that, you're more interested in a fast growing company with a rock-solid balance sheet, then check out our list of net cash growth stocks without delay.
If you're looking to trade L&T Technology Services, open an account with the lowest-cost platform trusted by professionals, Interactive Brokers.
With clients in over 200 countries and territories, and access to 160 markets, IBKR lets you trade stocks, options, futures, forex, bonds and funds from a single integrated account.
Enjoy no hidden fees, no account minimums, and FX conversion rates as low as 0.03%, far better than what most brokers offer.
Sponsored ContentNew: AI Stock Screener & Alerts
Our new AI Stock Screener scans the market every day to uncover opportunities.
• Dividend Powerhouses (3%+ Yield)
• Undervalued Small Caps with Insider Buying
• High growth Tech and AI Companies
Or build your own from over 50 metrics.
Have feedback on this article? Concerned about the content? Get in touch with us directly. Alternatively, email editorial-team (at) simplywallst.com.
This article by Simply Wall St is general in nature. We provide commentary based on historical data and analyst forecasts only using an unbiased methodology and our articles are not intended to be financial advice. It does not constitute a recommendation to buy or sell any stock, and does not take account of your objectives, or your financial situation. We aim to bring you long-term focused analysis driven by fundamental data. Note that our analysis may not factor in the latest price-sensitive company announcements or qualitative material. Simply Wall St has no position in any stocks mentioned.
About NSEI:LTTS
L&T Technology Services
Operates as an engineering research and development services company in India, the United States, Europe, and internationally.
Flawless balance sheet with moderate growth potential.
Similar Companies
Market Insights

Community Narratives

