
Advertisement
- India
- /
- Professional Services
- /
- NSEI:CADSYS
Cadsys (India)'s (NSE:CADSYS) Returns On Capital Not Reflecting Well On The Business
What are the early trends we should look for to identify a stock that could multiply in value over the long term? Ideally, a business will show two trends; firstly a growing return on capital employed (ROCE) and secondly, an increasing amount of capital employed. Basically this means that a company has profitable initiatives that it can continue to reinvest in, which is a trait of a compounding machine. In light of that, when we looked at Cadsys (India) (NSE:CADSYS) and its ROCE trend, we weren't exactly thrilled.
What Is Return On Capital Employed (ROCE)?
For those that aren't sure what ROCE is, it measures the amount of pre-tax profits a company can generate from the capital employed in its business. The formula for this calculation on Cadsys (India) is:
Return on Capital Employed = Earnings Before Interest and Tax (EBIT) ÷ (Total Assets - Current Liabilities)
0.014 = ₹24m ÷ (₹2.3b - ₹658m) (Based on the trailing twelve months to September 2024).
So, Cadsys (India) has an ROCE of 1.4%. Ultimately, that's a low return and it under-performs the Professional Services industry average of 11%.
See our latest analysis for Cadsys (India)
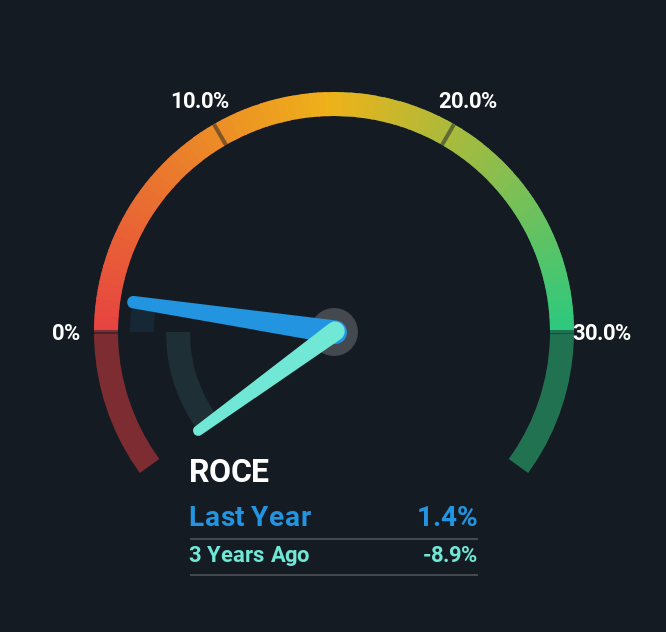
Historical performance is a great place to start when researching a stock so above you can see the gauge for Cadsys (India)'s ROCE against it's prior returns. If you want to delve into the historical earnings , check out these free graphs detailing revenue and cash flow performance of Cadsys (India).
What Does the ROCE Trend For Cadsys (India) Tell Us?
When we looked at the ROCE trend at Cadsys (India), we didn't gain much confidence. Over the last five years, returns on capital have decreased to 1.4% from 13% five years ago. Given the business is employing more capital while revenue has slipped, this is a bit concerning. This could mean that the business is losing its competitive advantage or market share, because while more money is being put into ventures, it's actually producing a lower return - "less bang for their buck" per se.
While on the subject, we noticed that the ratio of current liabilities to total assets has risen to 28%, which has impacted the ROCE. If current liabilities hadn't increased as much as they did, the ROCE could actually be even lower. While the ratio isn't currently too high, it's worth keeping an eye on this because if it gets particularly high, the business could then face some new elements of risk.
The Bottom Line On Cadsys (India)'s ROCE
From the above analysis, we find it rather worrisome that returns on capital and sales for Cadsys (India) have fallen, meanwhile the business is employing more capital than it was five years ago. The market must be rosy on the stock's future because even though the underlying trends aren't too encouraging, the stock has soared 191%. Regardless, we don't feel too comfortable with the fundamentals so we'd be steering clear of this stock for now.
If you want to know some of the risks facing Cadsys (India) we've found 3 warning signs (2 can't be ignored!) that you should be aware of before investing here.
While Cadsys (India) may not currently earn the highest returns, we've compiled a list of companies that currently earn more than 25% return on equity. Check out this free list here.
New: AI Stock Screener & Alerts
Our new AI Stock Screener scans the market every day to uncover opportunities.
• Dividend Powerhouses (3%+ Yield)
• Undervalued Small Caps with Insider Buying
• High growth Tech and AI Companies
Or build your own from over 50 metrics.
Have feedback on this article? Concerned about the content? Get in touch with us directly. Alternatively, email editorial-team (at) simplywallst.com.
This article by Simply Wall St is general in nature. We provide commentary based on historical data and analyst forecasts only using an unbiased methodology and our articles are not intended to be financial advice. It does not constitute a recommendation to buy or sell any stock, and does not take account of your objectives, or your financial situation. We aim to bring you long-term focused analysis driven by fundamental data. Note that our analysis may not factor in the latest price-sensitive company announcements or qualitative material. Simply Wall St has no position in any stocks mentioned.
About NSEI:CADSYS
Cadsys (India)
A knowledge process outsourcing company, provides knowledge solutions in India and internationally.
Moderate risk and slightly overvalued.
Similar Companies
Market Insights

Advertisement
Community Narratives
MINISO's fair value is projected at 26.69 with an anticipated PE ratio shift of 20x
Fair Value US$24.03|11.0% undervalued
BE
Community Contributor
Procter & Gamble: A Dividend Giant Facing Slowing Growth
Fair Value US$119.81|23.3% overvalued
AN
Community Contributor
Eli Lilly's Future Growth Driven by Tirzepatide and Favorable Market Conditions
Fair Value US$1.19k|13.8% undervalued
EA
Community Contributor