- India
- /
- Construction
- /
- NSEI:VPRPL
Investors Give Vishnu Prakash R Punglia Limited (NSE:VPRPL) Shares A 26% Hiding


Vishnu Prakash R Punglia Limited (NSE:VPRPL) shares have had a horrible month, losing 26% after a relatively good period beforehand. To make matters worse, the recent drop has wiped out a year's worth of gains with the share price now back where it started a year ago.
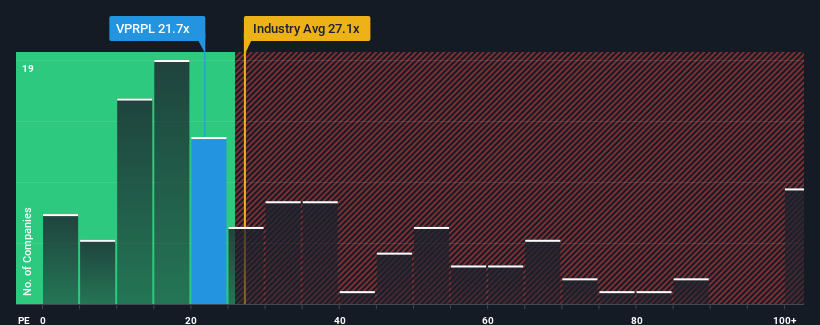
Even after such a large drop in price, Vishnu Prakash R Punglia's price-to-earnings (or "P/E") ratio of 21.7x might still make it look like a buy right now compared to the market in India, where around half of the companies have P/E ratios above 31x and even P/E's above 57x are quite common. Although, it's not wise to just take the P/E at face value as there may be an explanation why it's limited.
For example, consider that Vishnu Prakash R Punglia's financial performance has been pretty ordinary lately as earnings growth is non-existent. One possibility is that the P/E is low because investors think this benign earnings growth rate will likely underperform the broader market in the near future. If you like the company, you'd be hoping this isn't the case so that you could potentially pick up some stock while it's out of favour.
Check out our latest analysis for Vishnu Prakash R Punglia
How Is Vishnu Prakash R Punglia's Growth Trending?
There's an inherent assumption that a company should underperform the market for P/E ratios like Vishnu Prakash R Punglia's to be considered reasonable.
Taking a look back first, we see that there was hardly any earnings per share growth to speak of for the company over the past year. Although pleasingly EPS has lifted 239% in aggregate from three years ago, notwithstanding the last 12 months. Therefore, it's fair to say the earnings growth recently has been superb for the company.
Comparing that to the market, which is only predicted to deliver 24% growth in the next 12 months, the company's momentum is stronger based on recent medium-term annualised earnings results.
In light of this, it's peculiar that Vishnu Prakash R Punglia's P/E sits below the majority of other companies. Apparently some shareholders believe the recent performance has exceeded its limits and have been accepting significantly lower selling prices.
The Final Word
Vishnu Prakash R Punglia's P/E has taken a tumble along with its share price. It's argued the price-to-earnings ratio is an inferior measure of value within certain industries, but it can be a powerful business sentiment indicator.
Our examination of Vishnu Prakash R Punglia revealed its three-year earnings trends aren't contributing to its P/E anywhere near as much as we would have predicted, given they look better than current market expectations. There could be some major unobserved threats to earnings preventing the P/E ratio from matching this positive performance. At least price risks look to be very low if recent medium-term earnings trends continue, but investors seem to think future earnings could see a lot of volatility.
A lot of potential risks can sit within a company's balance sheet. Our free balance sheet analysis for Vishnu Prakash R Punglia with six simple checks will allow you to discover any risks that could be an issue.
If you're unsure about the strength of Vishnu Prakash R Punglia's business, why not explore our interactive list of stocks with solid business fundamentals for some other companies you may have missed.
New: Manage All Your Stock Portfolios in One Place
We've created the ultimate portfolio companion for stock investors, and it's free.
• Connect an unlimited number of Portfolios and see your total in one currency
• Be alerted to new Warning Signs or Risks via email or mobile
• Track the Fair Value of your stocks
Have feedback on this article? Concerned about the content? Get in touch with us directly. Alternatively, email editorial-team (at) simplywallst.com.
This article by Simply Wall St is general in nature. We provide commentary based on historical data and analyst forecasts only using an unbiased methodology and our articles are not intended to be financial advice. It does not constitute a recommendation to buy or sell any stock, and does not take account of your objectives, or your financial situation. We aim to bring you long-term focused analysis driven by fundamental data. Note that our analysis may not factor in the latest price-sensitive company announcements or qualitative material. Simply Wall St has no position in any stocks mentioned.
About NSEI:VPRPL
Vishnu Prakash R Punglia
Operates as an engineering, procurement, and construction company in India.
Adequate balance sheet and slightly overvalued.
