
Advertisement
- India
- /
- Electrical
- /
- NSEI:SPECTRUM
What Spectrum Electrical Industries Limited's (NSE:SPECTRUM) 37% Share Price Gain Is Not Telling You
Spectrum Electrical Industries Limited (NSE:SPECTRUM) shareholders would be excited to see that the share price has had a great month, posting a 37% gain and recovering from prior weakness. The annual gain comes to 262% following the latest surge, making investors sit up and take notice.
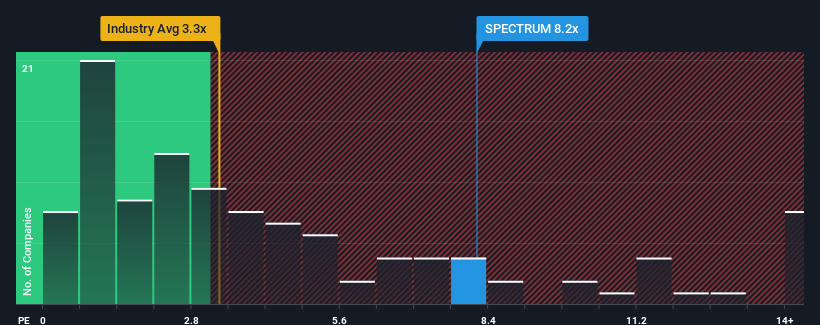
After such a large jump in price, you could be forgiven for thinking Spectrum Electrical Industries is a stock to steer clear of with a price-to-sales ratios (or "P/S") of 8.2x, considering almost half the companies in India's Electrical industry have P/S ratios below 3.3x. However, the P/S might be quite high for a reason and it requires further investigation to determine if it's justified.
See our latest analysis for Spectrum Electrical Industries
How Has Spectrum Electrical Industries Performed Recently?
Revenue has risen firmly for Spectrum Electrical Industries recently, which is pleasing to see. Perhaps the market is expecting this decent revenue performance to beat out the industry over the near term, which has kept the P/S propped up. However, if this isn't the case, investors might get caught out paying too much for the stock.
Although there are no analyst estimates available for Spectrum Electrical Industries, take a look at this free data-rich visualisation to see how the company stacks up on earnings, revenue and cash flow.Is There Enough Revenue Growth Forecasted For Spectrum Electrical Industries?
There's an inherent assumption that a company should far outperform the industry for P/S ratios like Spectrum Electrical Industries' to be considered reasonable.
If we review the last year of revenue growth, the company posted a terrific increase of 29%. The latest three year period has also seen an excellent 117% overall rise in revenue, aided by its short-term performance. Therefore, it's fair to say the revenue growth recently has been superb for the company.
Weighing that recent medium-term revenue trajectory against the broader industry's one-year forecast for expansion of 29% shows it's about the same on an annualised basis.
In light of this, it's curious that Spectrum Electrical Industries' P/S sits above the majority of other companies. It seems most investors are ignoring the fairly average recent growth rates and are willing to pay up for exposure to the stock. Although, additional gains will be difficult to achieve as a continuation of recent revenue trends would weigh down the share price eventually.
The Key Takeaway
The strong share price surge has lead to Spectrum Electrical Industries' P/S soaring as well. While the price-to-sales ratio shouldn't be the defining factor in whether you buy a stock or not, it's quite a capable barometer of revenue expectations.
Our look into Spectrum Electrical Industries has shown that it currently trades on a higher than expected P/S since its recent three-year growth is only in line with the wider industry forecast. Right now we are uncomfortable with the high P/S as this revenue performance isn't likely to support such positive sentiment for long. Unless there is a significant improvement in the company's medium-term trends, it will be difficult to prevent the P/S ratio from declining to a more reasonable level.
Don't forget that there may be other risks. For instance, we've identified 2 warning signs for Spectrum Electrical Industries (1 is a bit unpleasant) you should be aware of.
It's important to make sure you look for a great company, not just the first idea you come across. So if growing profitability aligns with your idea of a great company, take a peek at this free list of interesting companies with strong recent earnings growth (and a low P/E).
New: Manage All Your Stock Portfolios in One Place
We've created the ultimate portfolio companion for stock investors, and it's free.
• Connect an unlimited number of Portfolios and see your total in one currency
• Be alerted to new Warning Signs or Risks via email or mobile
• Track the Fair Value of your stocks
Have feedback on this article? Concerned about the content? Get in touch with us directly. Alternatively, email editorial-team (at) simplywallst.com.
This article by Simply Wall St is general in nature. We provide commentary based on historical data and analyst forecasts only using an unbiased methodology and our articles are not intended to be financial advice. It does not constitute a recommendation to buy or sell any stock, and does not take account of your objectives, or your financial situation. We aim to bring you long-term focused analysis driven by fundamental data. Note that our analysis may not factor in the latest price-sensitive company announcements or qualitative material. Simply Wall St has no position in any stocks mentioned.
About NSEI:SPECTRUM
Spectrum Electrical Industries
Designs, manufactures, and sells electrical, automobile, and irrigation components in India.
Solid track record with mediocre balance sheet.
Market Insights

Advertisement
Community Narratives
Quality at a Premium. A time to watch, not to buy?
Fair Value US$154.56|30.1% undervalued
DA
Community Contributor
GRAB: The Super-App at the Heart of Southeast Asia’s Digital Boom
Fair Value US$8.20|25.6% undervalued
BL
Community Contributor
Verve Group to Surge with 51.61% Revenue Growth
Fair Value €6.00|63.2% undervalued
ME
Community Contributor