- India
- /
- Capital Markets
- /
- NSEI:SPCENET
Spacenet Enterprises India Limited (NSE:SPCENET) Stocks Pounded By 27% But Not Lagging Industry On Growth Or Pricing


Spacenet Enterprises India Limited (NSE:SPCENET) shares have had a horrible month, losing 27% after a relatively good period beforehand. Looking at the bigger picture, even after this poor month the stock is up 51% in the last year.
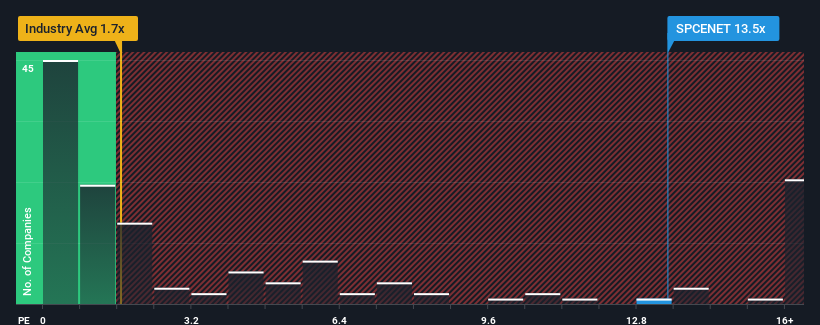
Even after such a large drop in price, given around half the companies in India's Trade Distributors industry have price-to-sales ratios (or "P/S") below 1.7x, you may still consider Spacenet Enterprises India as a stock to avoid entirely with its 13.5x P/S ratio. However, the P/S might be quite high for a reason and it requires further investigation to determine if it's justified.
See our latest analysis for Spacenet Enterprises India
How Has Spacenet Enterprises India Performed Recently?
As an illustration, revenue has deteriorated at Spacenet Enterprises India over the last year, which is not ideal at all. One possibility is that the P/S is high because investors think the company will still do enough to outperform the broader industry in the near future. You'd really hope so, otherwise you're paying a pretty hefty price for no particular reason.
We don't have analyst forecasts, but you can see how recent trends are setting up the company for the future by checking out our free report on Spacenet Enterprises India's earnings, revenue and cash flow.Do Revenue Forecasts Match The High P/S Ratio?
Spacenet Enterprises India's P/S ratio would be typical for a company that's expected to deliver very strong growth, and importantly, perform much better than the industry.
Retrospectively, the last year delivered a frustrating 24% decrease to the company's top line. The latest three year period has seen an incredible overall rise in revenue, a stark contrast to the last 12 months. So while the company has done a great job in the past, it's somewhat concerning to see revenue growth decline so harshly.
Comparing that to the industry, which is only predicted to deliver 4.3% growth in the next 12 months, the company's momentum is stronger based on recent medium-term annualised revenue results.
With this in consideration, it's not hard to understand why Spacenet Enterprises India's P/S is high relative to its industry peers. It seems most investors are expecting this strong growth to continue and are willing to pay more for the stock.
What We Can Learn From Spacenet Enterprises India's P/S?
Even after such a strong price drop, Spacenet Enterprises India's P/S still exceeds the industry median significantly. Generally, our preference is to limit the use of the price-to-sales ratio to establishing what the market thinks about the overall health of a company.
It's no surprise that Spacenet Enterprises India can support its high P/S given the strong revenue growth its experienced over the last three-year is superior to the current industry outlook. In the eyes of shareholders, the probability of a continued growth trajectory is great enough to prevent the P/S from pulling back. Unless the recent medium-term conditions change, they will continue to provide strong support to the share price.
We don't want to rain on the parade too much, but we did also find 1 warning sign for Spacenet Enterprises India that you need to be mindful of.
If companies with solid past earnings growth is up your alley, you may wish to see this free collection of other companies with strong earnings growth and low P/E ratios.
If you're looking to trade Spacenet Enterprises India, open an account with the lowest-cost platform trusted by professionals, Interactive Brokers.
With clients in over 200 countries and territories, and access to 160 markets, IBKR lets you trade stocks, options, futures, forex, bonds and funds from a single integrated account.
Enjoy no hidden fees, no account minimums, and FX conversion rates as low as 0.03%, far better than what most brokers offer.
Sponsored ContentNew: Manage All Your Stock Portfolios in One Place
We've created the ultimate portfolio companion for stock investors, and it's free.
• Connect an unlimited number of Portfolios and see your total in one currency
• Be alerted to new Warning Signs or Risks via email or mobile
• Track the Fair Value of your stocks
Have feedback on this article? Concerned about the content? Get in touch with us directly. Alternatively, email editorial-team (at) simplywallst.com.
This article by Simply Wall St is general in nature. We provide commentary based on historical data and analyst forecasts only using an unbiased methodology and our articles are not intended to be financial advice. It does not constitute a recommendation to buy or sell any stock, and does not take account of your objectives, or your financial situation. We aim to bring you long-term focused analysis driven by fundamental data. Note that our analysis may not factor in the latest price-sensitive company announcements or qualitative material. Simply Wall St has no position in any stocks mentioned.
About NSEI:SPCENET
Spacenet Enterprises India
Engages in the trading of commodities in India.
Flawless balance sheet with questionable track record.
Market Insights

Community Narratives

