- India
- /
- Construction
- /
- NSEI:SADBHAV
Investors Don't See Light At End Of Sadbhav Engineering Limited's (NSE:SADBHAV) Tunnel And Push Stock Down 26%


To the annoyance of some shareholders, Sadbhav Engineering Limited (NSE:SADBHAV) shares are down a considerable 26% in the last month, which continues a horrid run for the company. For any long-term shareholders, the last month ends a year to forget by locking in a 57% share price decline.
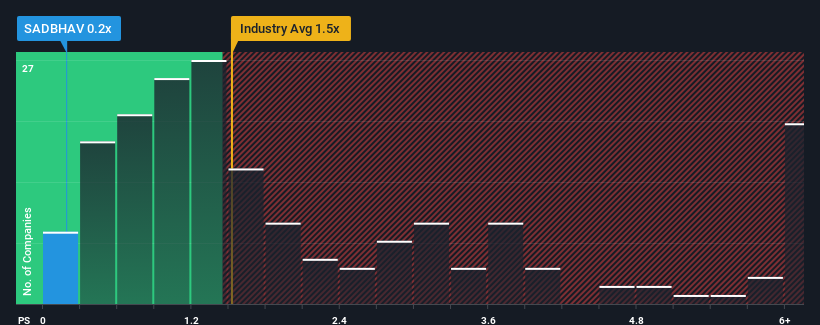
Since its price has dipped substantially, Sadbhav Engineering's price-to-sales (or "P/S") ratio of 0.2x might make it look like a buy right now compared to the Construction industry in India, where around half of the companies have P/S ratios above 1.5x and even P/S above 4x are quite common. However, the P/S might be low for a reason and it requires further investigation to determine if it's justified.
View our latest analysis for Sadbhav Engineering
How Sadbhav Engineering Has Been Performing
For instance, Sadbhav Engineering's receding revenue in recent times would have to be some food for thought. One possibility is that the P/S is low because investors think the company won't do enough to avoid underperforming the broader industry in the near future. Those who are bullish on Sadbhav Engineering will be hoping that this isn't the case so that they can pick up the stock at a lower valuation.
Although there are no analyst estimates available for Sadbhav Engineering, take a look at this free data-rich visualisation to see how the company stacks up on earnings, revenue and cash flow.Do Revenue Forecasts Match The Low P/S Ratio?
The only time you'd be truly comfortable seeing a P/S as low as Sadbhav Engineering's is when the company's growth is on track to lag the industry.
Taking a look back first, the company's revenue growth last year wasn't something to get excited about as it posted a disappointing decline of 35%. As a result, revenue from three years ago have also fallen 35% overall. So unfortunately, we have to acknowledge that the company has not done a great job of growing revenue over that time.
Comparing that to the industry, which is predicted to deliver 12% growth in the next 12 months, the company's downward momentum based on recent medium-term revenue results is a sobering picture.
With this in mind, we understand why Sadbhav Engineering's P/S is lower than most of its industry peers. However, we think shrinking revenues are unlikely to lead to a stable P/S over the longer term, which could set up shareholders for future disappointment. Even just maintaining these prices could be difficult to achieve as recent revenue trends are already weighing down the shares.
The Key Takeaway
The southerly movements of Sadbhav Engineering's shares means its P/S is now sitting at a pretty low level. Typically, we'd caution against reading too much into price-to-sales ratios when settling on investment decisions, though it can reveal plenty about what other market participants think about the company.
It's no surprise that Sadbhav Engineering maintains its low P/S off the back of its sliding revenue over the medium-term. Right now shareholders are accepting the low P/S as they concede future revenue probably won't provide any pleasant surprises either. Unless the recent medium-term conditions improve, they will continue to form a barrier for the share price around these levels.
It's always necessary to consider the ever-present spectre of investment risk. We've identified 3 warning signs with Sadbhav Engineering (at least 2 which make us uncomfortable), and understanding these should be part of your investment process.
If these risks are making you reconsider your opinion on Sadbhav Engineering, explore our interactive list of high quality stocks to get an idea of what else is out there.
New: Manage All Your Stock Portfolios in One Place
We've created the ultimate portfolio companion for stock investors, and it's free.
• Connect an unlimited number of Portfolios and see your total in one currency
• Be alerted to new Warning Signs or Risks via email or mobile
• Track the Fair Value of your stocks
Have feedback on this article? Concerned about the content? Get in touch with us directly. Alternatively, email editorial-team (at) simplywallst.com.
This article by Simply Wall St is general in nature. We provide commentary based on historical data and analyst forecasts only using an unbiased methodology and our articles are not intended to be financial advice. It does not constitute a recommendation to buy or sell any stock, and does not take account of your objectives, or your financial situation. We aim to bring you long-term focused analysis driven by fundamental data. Note that our analysis may not factor in the latest price-sensitive company announcements or qualitative material. Simply Wall St has no position in any stocks mentioned.
About NSEI:SADBHAV
Sadbhav Engineering
Engages in engineering, construction, and infrastructure development projects business in India.
Good value low.
Similar Companies
Market Insights

Community Narratives
