
Advertisement
- India
- /
- Construction
- /
- NSEI:RILINFRA
Rachana Infrastructure's (NSE:RILINFRA) Returns On Capital Not Reflecting Well On The Business

What are the early trends we should look for to identify a stock that could multiply in value over the long term? Amongst other things, we'll want to see two things; firstly, a growing return on capital employed (ROCE) and secondly, an expansion in the company's amount of capital employed. Put simply, these types of businesses are compounding machines, meaning they are continually reinvesting their earnings at ever-higher rates of return. However, after briefly looking over the numbers, we don't think Rachana Infrastructure (NSE:RILINFRA) has the makings of a multi-bagger going forward, but let's have a look at why that may be.
Understanding Return On Capital Employed (ROCE)
For those that aren't sure what ROCE is, it measures the amount of pre-tax profits a company can generate from the capital employed in its business. Analysts use this formula to calculate it for Rachana Infrastructure:
Return on Capital Employed = Earnings Before Interest and Tax (EBIT) ÷ (Total Assets - Current Liabilities)
0.041 = ₹42m ÷ (₹1.1b - ₹129m) (Based on the trailing twelve months to March 2023).
So, Rachana Infrastructure has an ROCE of 4.1%. Ultimately, that's a low return and it under-performs the Construction industry average of 13%.
See our latest analysis for Rachana Infrastructure
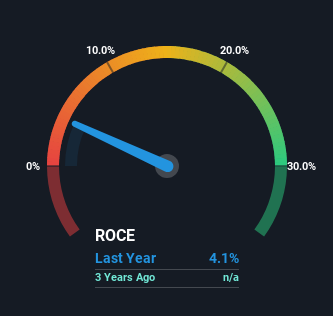
While the past is not representative of the future, it can be helpful to know how a company has performed historically, which is why we have this chart above. If you'd like to look at how Rachana Infrastructure has performed in the past in other metrics, you can view this free graph of past earnings, revenue and cash flow.
What Can We Tell From Rachana Infrastructure's ROCE Trend?
In terms of Rachana Infrastructure's historical ROCE movements, the trend isn't fantastic. Around two years ago the returns on capital were 9.7%, but since then they've fallen to 4.1%. On the other hand, the company has been employing more capital without a corresponding improvement in sales in the last year, which could suggest these investments are longer term plays. It may take some time before the company starts to see any change in earnings from these investments.
On a side note, Rachana Infrastructure has done well to pay down its current liabilities to 11% of total assets. So we could link some of this to the decrease in ROCE. Effectively this means their suppliers or short-term creditors are funding less of the business, which reduces some elements of risk. Since the business is basically funding more of its operations with it's own money, you could argue this has made the business less efficient at generating ROCE.
What We Can Learn From Rachana Infrastructure's ROCE
To conclude, we've found that Rachana Infrastructure is reinvesting in the business, but returns have been falling. It seems that investors have little hope of these trends getting any better and that may have partly contributed to the stock collapsing 91% in the last year. All in all, the inherent trends aren't typical of multi-baggers, so if that's what you're after, we think you might have more luck elsewhere.
One more thing to note, we've identified 2 warning signs with Rachana Infrastructure and understanding them should be part of your investment process.
While Rachana Infrastructure may not currently earn the highest returns, we've compiled a list of companies that currently earn more than 25% return on equity. Check out this free list here.
New: AI Stock Screener & Alerts
Our new AI Stock Screener scans the market every day to uncover opportunities.
• Dividend Powerhouses (3%+ Yield)
• Undervalued Small Caps with Insider Buying
• High growth Tech and AI Companies
Or build your own from over 50 metrics.
Have feedback on this article? Concerned about the content? Get in touch with us directly. Alternatively, email editorial-team (at) simplywallst.com.
This article by Simply Wall St is general in nature. We provide commentary based on historical data and analyst forecasts only using an unbiased methodology and our articles are not intended to be financial advice. It does not constitute a recommendation to buy or sell any stock, and does not take account of your objectives, or your financial situation. We aim to bring you long-term focused analysis driven by fundamental data. Note that our analysis may not factor in the latest price-sensitive company announcements or qualitative material. Simply Wall St has no position in any stocks mentioned.
About NSEI:RILINFRA
Rachana Infrastructure
Engages in the construction of road projects on the bill of quantities and engineering, procurement, and construction basis in India.
Adequate balance sheet with acceptable track record.
Similar Companies
Market Insights

Advertisement
Community Narratives
WhiteCap Is Positioned To Profit Regardless Of Trump's Policy 
Fair Value CA$22.60|61.7% undervalued
ST
Equity Analyst and Writer
Microsoft's Evolution Will Drive Revenue to New Heights Fueled by AI
Fair Value US$360.00|28.9% overvalued
BR
Community Contributor
A CASE FOR USD$2.50 (CAD$3.44) BY 2028 (A 5-10 BAGGER)
Fair Value CA$3.44|88.1% undervalued
AG
Community Contributor