
Advertisement
- India
- /
- Trade Distributors
- /
- NSEI:RAJMET
It's Down 26% But Rajnandini Metal Limited (NSE:RAJMET) Could Be Riskier Than It Looks

Unfortunately for some shareholders, the Rajnandini Metal Limited (NSE:RAJMET) share price has dived 26% in the last thirty days, prolonging recent pain. The recent drop completes a disastrous twelve months for shareholders, who are sitting on a 55% loss during that time.
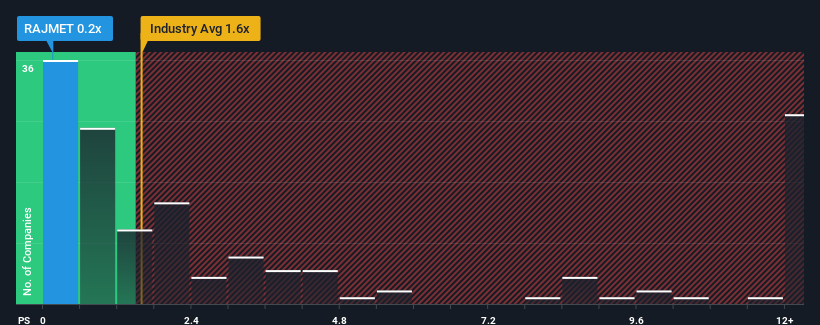
After such a large drop in price, Rajnandini Metal may be sending bullish signals at the moment with its price-to-sales (or "P/S") ratio of 0.2x, since almost half of all companies in the Trade Distributors industry in India have P/S ratios greater than 1.6x and even P/S higher than 6x are not unusual. However, the P/S might be low for a reason and it requires further investigation to determine if it's justified.
View our latest analysis for Rajnandini Metal
What Does Rajnandini Metal's P/S Mean For Shareholders?
As an illustration, revenue has deteriorated at Rajnandini Metal over the last year, which is not ideal at all. It might be that many expect the disappointing revenue performance to continue or accelerate, which has repressed the P/S. If you like the company, you'd be hoping this isn't the case so that you could potentially pick up some stock while it's out of favour.
Although there are no analyst estimates available for Rajnandini Metal, take a look at this free data-rich visualisation to see how the company stacks up on earnings, revenue and cash flow.Do Revenue Forecasts Match The Low P/S Ratio?
In order to justify its P/S ratio, Rajnandini Metal would need to produce sluggish growth that's trailing the industry.
Retrospectively, the last year delivered a frustrating 7.4% decrease to the company's top line. This has soured the latest three-year period, which nevertheless managed to deliver a decent 25% overall rise in revenue. So we can start by confirming that the company has generally done a good job of growing revenue over that time, even though it had some hiccups along the way.
Comparing that recent medium-term revenue trajectory with the industry's one-year growth forecast of 3.8% shows it's noticeably more attractive.
With this information, we find it odd that Rajnandini Metal is trading at a P/S lower than the industry. It looks like most investors are not convinced the company can maintain its recent growth rates.
The Final Word
Rajnandini Metal's recently weak share price has pulled its P/S back below other Trade Distributors companies. We'd say the price-to-sales ratio's power isn't primarily as a valuation instrument but rather to gauge current investor sentiment and future expectations.
We're very surprised to see Rajnandini Metal currently trading on a much lower than expected P/S since its recent three-year growth is higher than the wider industry forecast. When we see robust revenue growth that outpaces the industry, we presume that there are notable underlying risks to the company's future performance, which is exerting downward pressure on the P/S ratio. At least price risks look to be very low if recent medium-term revenue trends continue, but investors seem to think future revenue could see a lot of volatility.
It's always necessary to consider the ever-present spectre of investment risk. We've identified 2 warning signs with Rajnandini Metal (at least 1 which is a bit concerning), and understanding these should be part of your investment process.
If companies with solid past earnings growth is up your alley, you may wish to see this free collection of other companies with strong earnings growth and low P/E ratios.
New: AI Stock Screener & Alerts
Our new AI Stock Screener scans the market every day to uncover opportunities.
• Dividend Powerhouses (3%+ Yield)
• Undervalued Small Caps with Insider Buying
• High growth Tech and AI Companies
Or build your own from over 50 metrics.
Have feedback on this article? Concerned about the content? Get in touch with us directly. Alternatively, email editorial-team (at) simplywallst.com.
This article by Simply Wall St is general in nature. We provide commentary based on historical data and analyst forecasts only using an unbiased methodology and our articles are not intended to be financial advice. It does not constitute a recommendation to buy or sell any stock, and does not take account of your objectives, or your financial situation. We aim to bring you long-term focused analysis driven by fundamental data. Note that our analysis may not factor in the latest price-sensitive company announcements or qualitative material. Simply Wall St has no position in any stocks mentioned.
About NSEI:RAJMET
Rajnandini Metal
Engages in the manufacturing and trading of copper continuous casting rods and wires in India and internationally.
Good value with adequate balance sheet.
Similar Companies
Market Insights

Advertisement
Community Narratives
Groundbreaking therapies that could change the treatment landscape for PTSD, fibromyalgia, MS & Alzheimer’s
Fair Value US$6.20|86.9% undervalued
CM
Community Contributor
DigitalOcean Will Grow 14% by Embracing AI with Paperspace Acquisition
Fair Value US$50.00|42.8% undervalued
NE
Community Contributor
Viant Technology: A Rising AdTech Challenger in the AI-Powered CTV Market
Fair Value US$38.61|66.0% undervalued
BL
Community Contributor
Volvo will Accelerate Forward into Electric and Autonomous Leadership in Five Years
Fair Value SEK 438.80|40.8% undervalued
UN
Community Contributor