- India
- /
- Electrical
- /
- NSEI:PRECWIRE
Precision Wires India (NSE:PRECWIRE) Hasn't Managed To Accelerate Its Returns


Did you know there are some financial metrics that can provide clues of a potential multi-bagger? Ideally, a business will show two trends; firstly a growing return on capital employed (ROCE) and secondly, an increasing amount of capital employed. Basically this means that a company has profitable initiatives that it can continue to reinvest in, which is a trait of a compounding machine. That's why when we briefly looked at Precision Wires India's (NSE:PRECWIRE) ROCE trend, we were pretty happy with what we saw.
Return On Capital Employed (ROCE): What is it?
For those that aren't sure what ROCE is, it measures the amount of pre-tax profits a company can generate from the capital employed in its business. Analysts use this formula to calculate it for Precision Wires India:
Return on Capital Employed = Earnings Before Interest and Tax (EBIT) ÷ (Total Assets - Current Liabilities)
0.15 = ₹472m ÷ (₹6.1b - ₹3.0b) (Based on the trailing twelve months to December 2020).
Therefore, Precision Wires India has an ROCE of 15%. On its own, that's a standard return, however it's much better than the 11% generated by the Electrical industry.
See our latest analysis for Precision Wires India
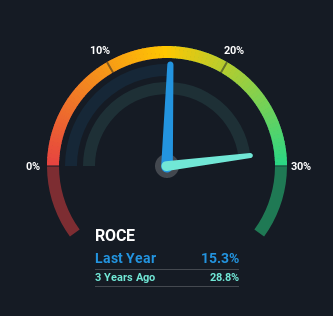
Historical performance is a great place to start when researching a stock so above you can see the gauge for Precision Wires India's ROCE against it's prior returns. If you want to delve into the historical earnings, revenue and cash flow of Precision Wires India, check out these free graphs here.
What The Trend Of ROCE Can Tell Us
While the returns on capital are good, they haven't moved much. Over the past five years, ROCE has remained relatively flat at around 15% and the business has deployed 53% more capital into its operations. 15% is a pretty standard return, and it provides some comfort knowing that Precision Wires India has consistently earned this amount. Stable returns in this ballpark can be unexciting, but if they can be maintained over the long run, they often provide nice rewards to shareholders.
On another note, while the change in ROCE trend might not scream for attention, it's interesting that the current liabilities have actually gone up over the last five years. This is intriguing because if current liabilities hadn't increased to 49% of total assets, this reported ROCE would probably be less than15% because total capital employed would be higher.The 15% ROCE could be even lower if current liabilities weren't 49% of total assets, because the the formula would show a larger base of total capital employed. So with current liabilities at such high levels, this effectively means the likes of suppliers or short-term creditors are funding a meaningful part of the business, which in some instances can bring some risks.
The Bottom Line On Precision Wires India's ROCE
The main thing to remember is that Precision Wires India has proven its ability to continually reinvest at respectable rates of return. And the stock has done incredibly well with a 159% return over the last five years, so long term investors are no doubt ecstatic with that result. So even though the stock might be more "expensive" than it was before, we think the strong fundamentals warrant this stock for further research.
If you'd like to know about the risks facing Precision Wires India, we've discovered 2 warning signs that you should be aware of.
If you want to search for solid companies with great earnings, check out this free list of companies with good balance sheets and impressive returns on equity.
If you decide to trade Precision Wires India, use the lowest-cost* platform that is rated #1 Overall by Barron’s, Interactive Brokers. Trade stocks, options, futures, forex, bonds and funds on 135 markets, all from a single integrated account. Promoted
New: Manage All Your Stock Portfolios in One Place
We've created the ultimate portfolio companion for stock investors, and it's free.
• Connect an unlimited number of Portfolios and see your total in one currency
• Be alerted to new Warning Signs or Risks via email or mobile
• Track the Fair Value of your stocks
This article by Simply Wall St is general in nature. It does not constitute a recommendation to buy or sell any stock, and does not take account of your objectives, or your financial situation. We aim to bring you long-term focused analysis driven by fundamental data. Note that our analysis may not factor in the latest price-sensitive company announcements or qualitative material. Simply Wall St has no position in any stocks mentioned.
*Interactive Brokers Rated Lowest Cost Broker by StockBrokers.com Annual Online Review 2020
Have feedback on this article? Concerned about the content? Get in touch with us directly. Alternatively, email editorial-team (at) simplywallst.com.
About NSEI:PRECWIRE
Precision Wires India
Manufactures and sells insulated enamelled wires and other insulated electric conductors in India and internationally.
Excellent balance sheet with proven track record.
Similar Companies
Market Insights

Community Narratives
