- India
- /
- Electrical
- /
- NSEI:POWERINDIA
Here's What's Concerning About Hitachi Energy India's (NSE:POWERINDIA) Returns On Capital


If we want to find a potential multi-bagger, often there are underlying trends that can provide clues. Firstly, we'd want to identify a growing return on capital employed (ROCE) and then alongside that, an ever-increasing base of capital employed. Put simply, these types of businesses are compounding machines, meaning they are continually reinvesting their earnings at ever-higher rates of return. In light of that, when we looked at Hitachi Energy India (NSE:POWERINDIA) and its ROCE trend, we weren't exactly thrilled.
Understanding Return On Capital Employed (ROCE)
For those who don't know, ROCE is a measure of a company's yearly pre-tax profit (its return), relative to the capital employed in the business. To calculate this metric for Hitachi Energy India, this is the formula:
Return on Capital Employed = Earnings Before Interest and Tax (EBIT) ÷ (Total Assets - Current Liabilities)
0.13 = ₹1.5b ÷ (₹35b - ₹23b) (Based on the trailing twelve months to June 2022).
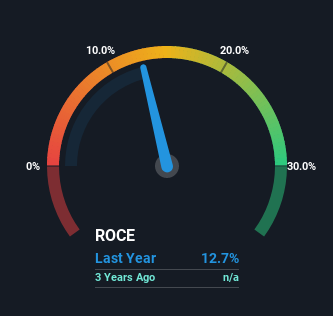
Therefore, Hitachi Energy India has an ROCE of 13%. That's a pretty standard return and it's in line with the industry average of 13%.
See our latest analysis for Hitachi Energy India
Above you can see how the current ROCE for Hitachi Energy India compares to its prior returns on capital, but there's only so much you can tell from the past. If you'd like, you can check out the forecasts from the analysts covering Hitachi Energy India here for free.
The Trend Of ROCE
When we looked at the ROCE trend at Hitachi Energy India, we didn't gain much confidence. Over the last two years, returns on capital have decreased to 13% from 36% two years ago. However it looks like Hitachi Energy India might be reinvesting for long term growth because while capital employed has increased, the company's sales haven't changed much in the last 12 months. It's worth keeping an eye on the company's earnings from here on to see if these investments do end up contributing to the bottom line.
On a separate but related note, it's important to know that Hitachi Energy India has a current liabilities to total assets ratio of 66%, which we'd consider pretty high. This effectively means that suppliers (or short-term creditors) are funding a large portion of the business, so just be aware that this can introduce some elements of risk. Ideally we'd like to see this reduce as that would mean fewer obligations bearing risks.
In Conclusion...
To conclude, we've found that Hitachi Energy India is reinvesting in the business, but returns have been falling. Since the stock has gained an impressive 40% over the last year, investors must think there's better things to come. But if the trajectory of these underlying trends continue, we think the likelihood of it being a multi-bagger from here isn't high.
One more thing to note, we've identified 1 warning sign with Hitachi Energy India and understanding it should be part of your investment process.
If you want to search for solid companies with great earnings, check out this free list of companies with good balance sheets and impressive returns on equity.
If you're looking to trade Hitachi Energy India, open an account with the lowest-cost platform trusted by professionals, Interactive Brokers.
With clients in over 200 countries and territories, and access to 160 markets, IBKR lets you trade stocks, options, futures, forex, bonds and funds from a single integrated account.
Enjoy no hidden fees, no account minimums, and FX conversion rates as low as 0.03%, far better than what most brokers offer.
Sponsored ContentValuation is complex, but we're here to simplify it.
Discover if Hitachi Energy India might be undervalued or overvalued with our detailed analysis, featuring fair value estimates, potential risks, dividends, insider trades, and its financial condition.
Access Free AnalysisHave feedback on this article? Concerned about the content? Get in touch with us directly. Alternatively, email editorial-team (at) simplywallst.com.
This article by Simply Wall St is general in nature. We provide commentary based on historical data and analyst forecasts only using an unbiased methodology and our articles are not intended to be financial advice. It does not constitute a recommendation to buy or sell any stock, and does not take account of your objectives, or your financial situation. We aim to bring you long-term focused analysis driven by fundamental data. Note that our analysis may not factor in the latest price-sensitive company announcements or qualitative material. Simply Wall St has no position in any stocks mentioned.
About NSEI:POWERINDIA
Hitachi Energy India
Offers products, projects, and services for electricity transmission and related activities in India and internationally.
Exceptional growth potential with outstanding track record.

