- India
- /
- Electrical
- /
- NSEI:POWERINDIA
Does Hitachi Energy India (NSE:POWERINDIA) Have A Healthy Balance Sheet?


Legendary fund manager Li Lu (who Charlie Munger backed) once said, 'The biggest investment risk is not the volatility of prices, but whether you will suffer a permanent loss of capital.' It's only natural to consider a company's balance sheet when you examine how risky it is, since debt is often involved when a business collapses. As with many other companies Hitachi Energy India Limited (NSE:POWERINDIA) makes use of debt. But the real question is whether this debt is making the company risky.
When Is Debt Dangerous?
Generally speaking, debt only becomes a real problem when a company can't easily pay it off, either by raising capital or with its own cash flow. If things get really bad, the lenders can take control of the business. However, a more frequent (but still costly) occurrence is where a company must issue shares at bargain-basement prices, permanently diluting shareholders, just to shore up its balance sheet. Of course, the upside of debt is that it often represents cheap capital, especially when it replaces dilution in a company with the ability to reinvest at high rates of return. The first thing to do when considering how much debt a business uses is to look at its cash and debt together.
Check out the opportunities and risks within the IN Electrical industry.
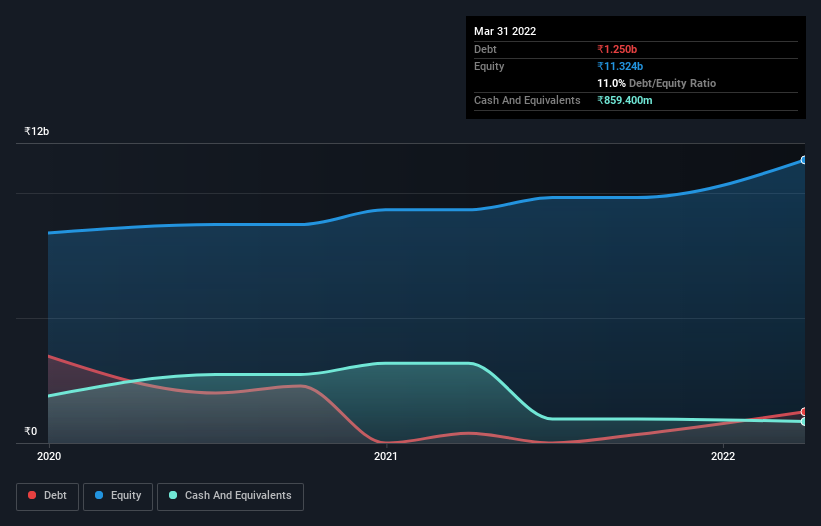
What Is Hitachi Energy India's Net Debt?
The image below, which you can click on for greater detail, shows that at September 2022 Hitachi Energy India had debt of ₹3.15b, up from ₹339.4m in one year. On the flip side, it has ₹1.15b in cash leading to net debt of about ₹2.00b.
How Strong Is Hitachi Energy India's Balance Sheet?
Zooming in on the latest balance sheet data, we can see that Hitachi Energy India had liabilities of ₹25.1b due within 12 months and liabilities of ₹534.5m due beyond that. Offsetting these obligations, it had cash of ₹1.15b as well as receivables valued at ₹14.4b due within 12 months. So its liabilities total ₹10.0b more than the combination of its cash and short-term receivables.
Given Hitachi Energy India has a market capitalization of ₹127.7b, it's hard to believe these liabilities pose much threat. But there are sufficient liabilities that we would certainly recommend shareholders continue to monitor the balance sheet, going forward.
We measure a company's debt load relative to its earnings power by looking at its net debt divided by its earnings before interest, tax, depreciation, and amortization (EBITDA) and by calculating how easily its earnings before interest and tax (EBIT) cover its interest expense (interest cover). Thus we consider debt relative to earnings both with and without depreciation and amortization expenses.
Looking at its net debt to EBITDA of 0.92 and interest cover of 5.4 times, it seems to us that Hitachi Energy India is probably using debt in a pretty reasonable way. So we'd recommend keeping a close eye on the impact financing costs are having on the business. Unfortunately, Hitachi Energy India's EBIT flopped 12% over the last four quarters. If that sort of decline is not arrested, then the managing its debt will be harder than selling broccoli flavoured ice-cream for a premium. There's no doubt that we learn most about debt from the balance sheet. But ultimately the future profitability of the business will decide if Hitachi Energy India can strengthen its balance sheet over time. So if you want to see what the professionals think, you might find this free report on analyst profit forecasts to be interesting.
Finally, a company can only pay off debt with cold hard cash, not accounting profits. So it's worth checking how much of that EBIT is backed by free cash flow. During the last three years, Hitachi Energy India produced sturdy free cash flow equating to 53% of its EBIT, about what we'd expect. This free cash flow puts the company in a good position to pay down debt, when appropriate.
Our View
Hitachi Energy India's EBIT growth rate was a real negative on this analysis, although the other factors we considered were considerably better. There's no doubt that it has an adequate capacity handle its debt, based on its EBITDA,. When we consider all the factors mentioned above, we do feel a bit cautious about Hitachi Energy India's use of debt. While we appreciate debt can enhance returns on equity, we'd suggest that shareholders keep close watch on its debt levels, lest they increase. When analysing debt levels, the balance sheet is the obvious place to start. But ultimately, every company can contain risks that exist outside of the balance sheet. For example, we've discovered 1 warning sign for Hitachi Energy India that you should be aware of before investing here.
When all is said and done, sometimes its easier to focus on companies that don't even need debt. Readers can access a list of growth stocks with zero net debt 100% free, right now.
If you're looking to trade Hitachi Energy India, open an account with the lowest-cost platform trusted by professionals, Interactive Brokers.
With clients in over 200 countries and territories, and access to 160 markets, IBKR lets you trade stocks, options, futures, forex, bonds and funds from a single integrated account.
Enjoy no hidden fees, no account minimums, and FX conversion rates as low as 0.03%, far better than what most brokers offer.
Sponsored ContentValuation is complex, but we're here to simplify it.
Discover if Hitachi Energy India might be undervalued or overvalued with our detailed analysis, featuring fair value estimates, potential risks, dividends, insider trades, and its financial condition.
Access Free AnalysisHave feedback on this article? Concerned about the content? Get in touch with us directly. Alternatively, email editorial-team (at) simplywallst.com.
This article by Simply Wall St is general in nature. We provide commentary based on historical data and analyst forecasts only using an unbiased methodology and our articles are not intended to be financial advice. It does not constitute a recommendation to buy or sell any stock, and does not take account of your objectives, or your financial situation. We aim to bring you long-term focused analysis driven by fundamental data. Note that our analysis may not factor in the latest price-sensitive company announcements or qualitative material. Simply Wall St has no position in any stocks mentioned.
About NSEI:POWERINDIA
Hitachi Energy India
Offers products, projects, and services for electricity transmission and related activities in India and internationally.
Exceptional growth potential with outstanding track record.

