- India
- /
- Electrical
- /
- NSEI:POWERINDIA
Be Wary Of Hitachi Energy India (NSE:POWERINDIA) And Its Returns On Capital


If we want to find a potential multi-bagger, often there are underlying trends that can provide clues. In a perfect world, we'd like to see a company investing more capital into its business and ideally the returns earned from that capital are also increasing. Ultimately, this demonstrates that it's a business that is reinvesting profits at increasing rates of return. Having said that, from a first glance at Hitachi Energy India (NSE:POWERINDIA) we aren't jumping out of our chairs at how returns are trending, but let's have a deeper look.
Return On Capital Employed (ROCE): What is it?
For those that aren't sure what ROCE is, it measures the amount of pre-tax profits a company can generate from the capital employed in its business. The formula for this calculation on Hitachi Energy India is:
Return on Capital Employed = Earnings Before Interest and Tax (EBIT) ÷ (Total Assets - Current Liabilities)
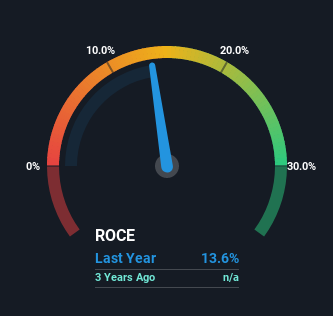
0.14 = ₹1.6b ÷ (₹35b - ₹23b) (Based on the trailing twelve months to March 2022).
Thus, Hitachi Energy India has an ROCE of 14%. In absolute terms, that's a pretty normal return, and it's somewhat close to the Electrical industry average of 12%.
See our latest analysis for Hitachi Energy India
In the above chart we have measured Hitachi Energy India's prior ROCE against its prior performance, but the future is arguably more important. If you'd like, you can check out the forecasts from the analysts covering Hitachi Energy India here for free.
What The Trend Of ROCE Can Tell Us
In terms of Hitachi Energy India's historical ROCE movements, the trend isn't fantastic. To be more specific, ROCE has fallen from 38% over the last two years. On the other hand, the company has been employing more capital without a corresponding improvement in sales in the last year, which could suggest these investments are longer term plays. It's worth keeping an eye on the company's earnings from here on to see if these investments do end up contributing to the bottom line.
Another thing to note, Hitachi Energy India has a high ratio of current liabilities to total assets of 66%. This can bring about some risks because the company is basically operating with a rather large reliance on its suppliers or other sorts of short-term creditors. While it's not necessarily a bad thing, it can be beneficial if this ratio is lower.
In Conclusion...
In summary, Hitachi Energy India is reinvesting funds back into the business for growth but unfortunately it looks like sales haven't increased much just yet. Since the stock has gained an impressive 73% over the last year, investors must think there's better things to come. However, unless these underlying trends turn more positive, we wouldn't get our hopes up too high.
If you want to continue researching Hitachi Energy India, you might be interested to know about the 1 warning sign that our analysis has discovered.
For those who like to invest in solid companies, check out this free list of companies with solid balance sheets and high returns on equity.
If you're looking to trade Hitachi Energy India, open an account with the lowest-cost platform trusted by professionals, Interactive Brokers.
With clients in over 200 countries and territories, and access to 160 markets, IBKR lets you trade stocks, options, futures, forex, bonds and funds from a single integrated account.
Enjoy no hidden fees, no account minimums, and FX conversion rates as low as 0.03%, far better than what most brokers offer.
Sponsored ContentValuation is complex, but we're here to simplify it.
Discover if Hitachi Energy India might be undervalued or overvalued with our detailed analysis, featuring fair value estimates, potential risks, dividends, insider trades, and its financial condition.
Access Free AnalysisHave feedback on this article? Concerned about the content? Get in touch with us directly. Alternatively, email editorial-team (at) simplywallst.com.
This article by Simply Wall St is general in nature. We provide commentary based on historical data and analyst forecasts only using an unbiased methodology and our articles are not intended to be financial advice. It does not constitute a recommendation to buy or sell any stock, and does not take account of your objectives, or your financial situation. We aim to bring you long-term focused analysis driven by fundamental data. Note that our analysis may not factor in the latest price-sensitive company announcements or qualitative material. Simply Wall St has no position in any stocks mentioned.
About NSEI:POWERINDIA
Hitachi Energy India
Offers products, projects, and services for electricity transmission and related activities in India and internationally.
Exceptional growth potential with outstanding track record.

