- India
- /
- Industrials
- /
- NSEI:NAVA
Nava Limited's (NSE:NAVA) Stock Is Going Strong: Is the Market Following Fundamentals?


Nava's (NSE:NAVA) stock is up by a considerable 74% over the past three months. Given the company's impressive performance, we decided to study its financial indicators more closely as a company's financial health over the long-term usually dictates market outcomes. In this article, we decided to focus on Nava's ROE.
Return on Equity or ROE is a test of how effectively a company is growing its value and managing investors’ money. Put another way, it reveals the company's success at turning shareholder investments into profits.
See our latest analysis for Nava
How Do You Calculate Return On Equity?
The formula for ROE is:
Return on Equity = Net Profit (from continuing operations) ÷ Shareholders' Equity
So, based on the above formula, the ROE for Nava is:
16% = ₹14b ÷ ₹83b (Based on the trailing twelve months to June 2024).
The 'return' is the income the business earned over the last year. So, this means that for every ₹1 of its shareholder's investments, the company generates a profit of ₹0.16.
What Has ROE Got To Do With Earnings Growth?
Thus far, we have learned that ROE measures how efficiently a company is generating its profits. Depending on how much of these profits the company reinvests or "retains", and how effectively it does so, we are then able to assess a company’s earnings growth potential. Assuming everything else remains unchanged, the higher the ROE and profit retention, the higher the growth rate of a company compared to companies that don't necessarily bear these characteristics.
A Side By Side comparison of Nava's Earnings Growth And 16% ROE
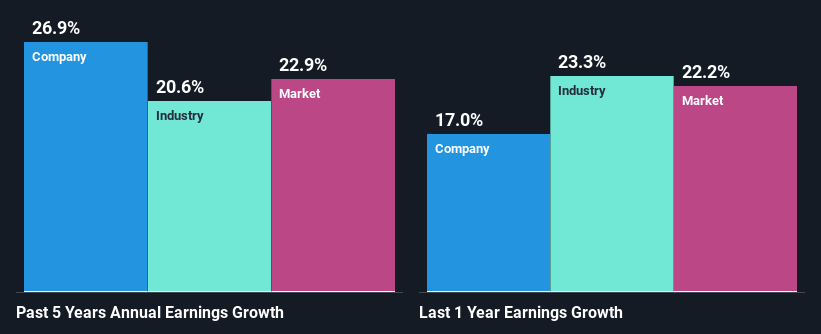
To start with, Nava's ROE looks acceptable. Even when compared to the industry average of 16% the company's ROE looks quite decent. This probably goes some way in explaining Nava's significant 27% net income growth over the past five years amongst other factors. However, there could also be other drivers behind this growth. For example, it is possible that the company's management has made some good strategic decisions, or that the company has a low payout ratio.
As a next step, we compared Nava's net income growth with the industry, and pleasingly, we found that the growth seen by the company is higher than the average industry growth of 21%.
Earnings growth is an important metric to consider when valuing a stock. What investors need to determine next is if the expected earnings growth, or the lack of it, is already built into the share price. This then helps them determine if the stock is placed for a bright or bleak future. One good indicator of expected earnings growth is the P/E ratio which determines the price the market is willing to pay for a stock based on its earnings prospects. So, you may want to check if Nava is trading on a high P/E or a low P/E, relative to its industry.
Is Nava Making Efficient Use Of Its Profits?
Nava's three-year median payout ratio to shareholders is 9.4%, which is quite low. This implies that the company is retaining 91% of its profits. So it looks like Nava is reinvesting profits heavily to grow its business, which shows in its earnings growth.
Besides, Nava has been paying dividends for at least ten years or more. This shows that the company is committed to sharing profits with its shareholders.
Summary
Overall, we are quite pleased with Nava's performance. In particular, it's great to see that the company is investing heavily into its business and along with a high rate of return, that has resulted in a sizeable growth in its earnings. If the company continues to grow its earnings the way it has, that could have a positive impact on its share price given how earnings per share influence long-term share prices. Not to forget, share price outcomes are also dependent on the potential risks a company may face. So it is important for investors to be aware of the risks involved in the business. Our risks dashboard will have the 1 risk we have identified for Nava.
Valuation is complex, but we're here to simplify it.
Discover if Nava might be undervalued or overvalued with our detailed analysis, featuring fair value estimates, potential risks, dividends, insider trades, and its financial condition.
Access Free AnalysisHave feedback on this article? Concerned about the content? Get in touch with us directly. Alternatively, email editorial-team (at) simplywallst.com.
This article by Simply Wall St is general in nature. We provide commentary based on historical data and analyst forecasts only using an unbiased methodology and our articles are not intended to be financial advice. It does not constitute a recommendation to buy or sell any stock, and does not take account of your objectives, or your financial situation. We aim to bring you long-term focused analysis driven by fundamental data. Note that our analysis may not factor in the latest price-sensitive company announcements or qualitative material. Simply Wall St has no position in any stocks mentioned.
About NSEI:NAVA
Nava
Engages in the ferro alloys, power, mining, and healthcare businesses in India and internationally.
Flawless balance sheet, good value and pays a dividend.
Market Insights

Community Narratives

