
Howard Marks put it nicely when he said that, rather than worrying about share price volatility, 'The possibility of permanent loss is the risk I worry about... and every practical investor I know worries about.' It's only natural to consider a company's balance sheet when you examine how risky it is, since debt is often involved when a business collapses. Importantly, IRB Infrastructure Developers Limited (NSE:IRB) does carry debt. But the more important question is: how much risk is that debt creating?
What Risk Does Debt Bring?
Debt is a tool to help businesses grow, but if a business is incapable of paying off its lenders, then it exists at their mercy. In the worst case scenario, a company can go bankrupt if it cannot pay its creditors. However, a more frequent (but still costly) occurrence is where a company must issue shares at bargain-basement prices, permanently diluting shareholders, just to shore up its balance sheet. Of course, plenty of companies use debt to fund growth, without any negative consequences. The first step when considering a company's debt levels is to consider its cash and debt together.
Check out our latest analysis for IRB Infrastructure Developers
What Is IRB Infrastructure Developers's Net Debt?
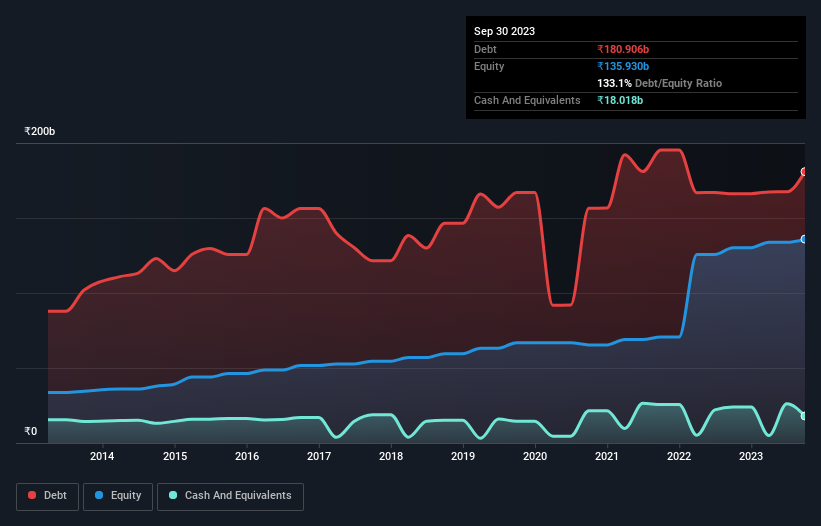
You can click the graphic below for the historical numbers, but it shows that as of September 2023 IRB Infrastructure Developers had ₹180.9b of debt, an increase on ₹166.1b, over one year. However, because it has a cash reserve of ₹18.0b, its net debt is less, at about ₹162.9b.
A Look At IRB Infrastructure Developers' Liabilities
According to the last reported balance sheet, IRB Infrastructure Developers had liabilities of ₹66.6b due within 12 months, and liabilities of ₹238.8b due beyond 12 months. Offsetting these obligations, it had cash of ₹18.0b as well as receivables valued at ₹14.4b due within 12 months. So its liabilities outweigh the sum of its cash and (near-term) receivables by ₹273.0b.
When you consider that this deficiency exceeds the company's ₹260.6b market capitalization, you might well be inclined to review the balance sheet intently. In the scenario where the company had to clean up its balance sheet quickly, it seems likely shareholders would suffer extensive dilution.
We use two main ratios to inform us about debt levels relative to earnings. The first is net debt divided by earnings before interest, tax, depreciation, and amortization (EBITDA), while the second is how many times its earnings before interest and tax (EBIT) covers its interest expense (or its interest cover, for short). The advantage of this approach is that we take into account both the absolute quantum of debt (with net debt to EBITDA) and the actual interest expenses associated with that debt (with its interest cover ratio).
Weak interest cover of 1.7 times and a disturbingly high net debt to EBITDA ratio of 5.3 hit our confidence in IRB Infrastructure Developers like a one-two punch to the gut. This means we'd consider it to have a heavy debt load. Even more troubling is the fact that IRB Infrastructure Developers actually let its EBIT decrease by 6.8% over the last year. If it keeps going like that paying off its debt will be like running on a treadmill -- a lot of effort for not much advancement. The balance sheet is clearly the area to focus on when you are analysing debt. But ultimately the future profitability of the business will decide if IRB Infrastructure Developers can strengthen its balance sheet over time. So if you're focused on the future you can check out this free report showing analyst profit forecasts.
Finally, a business needs free cash flow to pay off debt; accounting profits just don't cut it. So the logical step is to look at the proportion of that EBIT that is matched by actual free cash flow. Looking at the most recent three years, IRB Infrastructure Developers recorded free cash flow of 26% of its EBIT, which is weaker than we'd expect. That's not great, when it comes to paying down debt.
Our View
On the face of it, IRB Infrastructure Developers's net debt to EBITDA left us tentative about the stock, and its interest cover was no more enticing than the one empty restaurant on the busiest night of the year. And furthermore, its EBIT growth rate also fails to instill confidence. Overall, it seems to us that IRB Infrastructure Developers's balance sheet is really quite a risk to the business. So we're almost as wary of this stock as a hungry kitten is about falling into its owner's fish pond: once bitten, twice shy, as they say. The balance sheet is clearly the area to focus on when you are analysing debt. But ultimately, every company can contain risks that exist outside of the balance sheet. We've identified 3 warning signs with IRB Infrastructure Developers (at least 1 which is significant) , and understanding them should be part of your investment process.
At the end of the day, it's often better to focus on companies that are free from net debt. You can access our special list of such companies (all with a track record of profit growth). It's free.
Mobile Infrastructure for Defense and Disaster
The next wave in robotics isn't humanoid. Its fully autonomous towers delivering 5G, ISR, and radar in under 30 minutes, anywhere.
Get the investor briefing before the next round of contracts
Sponsored On Behalf of CiTechNew: AI Stock Screener & Alerts
Our new AI Stock Screener scans the market every day to uncover opportunities.
• Dividend Powerhouses (3%+ Yield)
• Undervalued Small Caps with Insider Buying
• High growth Tech and AI Companies
Or build your own from over 50 metrics.
Have feedback on this article? Concerned about the content? Get in touch with us directly. Alternatively, email editorial-team (at) simplywallst.com.
This article by Simply Wall St is general in nature. We provide commentary based on historical data and analyst forecasts only using an unbiased methodology and our articles are not intended to be financial advice. It does not constitute a recommendation to buy or sell any stock, and does not take account of your objectives, or your financial situation. We aim to bring you long-term focused analysis driven by fundamental data. Note that our analysis may not factor in the latest price-sensitive company announcements or qualitative material. Simply Wall St has no position in any stocks mentioned.
About NSEI:IRB
IRB Infrastructure Developers
Engages in the infrastructure development business in India.
Very undervalued with proven track record.
Similar Companies
Market Insights

Weekly Picks

Early mover in a fast growing industry. Likely to experience share price volatility as they scale


A case for CA$31.80 (undiluted), aka 8,616% upside from CA$0.37 (an 86 bagger!).


Moderation and Stabilisation: HOLD: Fair Price based on a 4-year Cycle is $12.08
Recently Updated Narratives


An amazing opportunity to potentially get a 100 bagger

Amazon: Why the World’s Biggest Platform Still Runs on Invisible Economics

Sunrun Stock: When the Energy Transition Collides With the Cost of Capital
Popular Narratives


MicroVision will explode future revenue by 380.37% with a vision towards success


Crazy Undervalued 42 Baggers Silver Play (Active & Running Mine)

