- India
- /
- Electrical
- /
- NSEI:HBLENGINE
HBL Power Systems (NSE:HBLPOWER) May Have Issues Allocating Its Capital


If we're looking to avoid a business that is in decline, what are the trends that can warn us ahead of time? When we see a declining return on capital employed (ROCE) in conjunction with a declining base of capital employed, that's often how a mature business shows signs of aging. This combination can tell you that not only is the company investing less, it's earning less on what it does invest. So after glancing at the trends within HBL Power Systems (NSE:HBLPOWER), we weren't too hopeful.
Understanding Return On Capital Employed (ROCE)
For those who don't know, ROCE is a measure of a company's yearly pre-tax profit (its return), relative to the capital employed in the business. Analysts use this formula to calculate it for HBL Power Systems:
Return on Capital Employed = Earnings Before Interest and Tax (EBIT) ÷ (Total Assets - Current Liabilities)
0.035 = ₹286m ÷ (₹10b - ₹2.2b) (Based on the trailing twelve months to March 2021).
Thus, HBL Power Systems has an ROCE of 3.5%. In absolute terms, that's a low return and it also under-performs the Electrical industry average of 9.8%.
Check out our latest analysis for HBL Power Systems
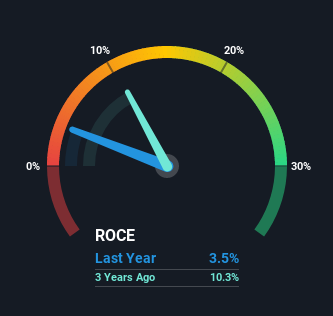
While the past is not representative of the future, it can be helpful to know how a company has performed historically, which is why we have this chart above. If you'd like to look at how HBL Power Systems has performed in the past in other metrics, you can view this free graph of past earnings, revenue and cash flow.
What Does the ROCE Trend For HBL Power Systems Tell Us?
There is reason to be cautious about HBL Power Systems, given the returns are trending downwards. About five years ago, returns on capital were 11%, however they're now substantially lower than that as we saw above. On top of that, it's worth noting that the amount of capital employed within the business has remained relatively steady. Since returns are falling and the business has the same amount of assets employed, this can suggest it's a mature business that hasn't had much growth in the last five years. So because these trends aren't typically conducive to creating a multi-bagger, we wouldn't hold our breath on HBL Power Systems becoming one if things continue as they have.
On a side note, HBL Power Systems has done well to pay down its current liabilities to 21% of total assets. That could partly explain why the ROCE has dropped. What's more, this can reduce some aspects of risk to the business because now the company's suppliers or short-term creditors are funding less of its operations. Since the business is basically funding more of its operations with it's own money, you could argue this has made the business less efficient at generating ROCE.
Our Take On HBL Power Systems' ROCE
All in all, the lower returns from the same amount of capital employed aren't exactly signs of a compounding machine. However the stock has delivered a 61% return to shareholders over the last five years, so investors might be expecting the trends to turn around. Regardless, we don't feel too comfortable with the fundamentals so we'd be steering clear of this stock for now.
HBL Power Systems does come with some risks though, we found 5 warning signs in our investment analysis, and 1 of those shouldn't be ignored...
If you want to search for solid companies with great earnings, check out this free list of companies with good balance sheets and impressive returns on equity.
If you decide to trade HBL Power Systems, use the lowest-cost* platform that is rated #1 Overall by Barron’s, Interactive Brokers. Trade stocks, options, futures, forex, bonds and funds on 135 markets, all from a single integrated account. Promoted
Valuation is complex, but we're here to simplify it.
Discover if HBL Engineering might be undervalued or overvalued with our detailed analysis, featuring fair value estimates, potential risks, dividends, insider trades, and its financial condition.
Access Free AnalysisThis article by Simply Wall St is general in nature. It does not constitute a recommendation to buy or sell any stock, and does not take account of your objectives, or your financial situation. We aim to bring you long-term focused analysis driven by fundamental data. Note that our analysis may not factor in the latest price-sensitive company announcements or qualitative material. Simply Wall St has no position in any stocks mentioned.
*Interactive Brokers Rated Lowest Cost Broker by StockBrokers.com Annual Online Review 2020
Have feedback on this article? Concerned about the content? Get in touch with us directly. Alternatively, email editorial-team (at) simplywallst.com.
About NSEI:HBLENGINE
HBL Engineering
Manufactures and sells batteries, power electronics, and spun concrete products in India and internationally.
Outstanding track record with flawless balance sheet.
Market Insights

Community Narratives


