Investors Still Aren't Entirely Convinced By Greaves Cotton Limited's (NSE:GREAVESCOT) Revenues Despite 38% Price Jump


Greaves Cotton Limited (NSE:GREAVESCOT) shares have had a really impressive month, gaining 38% after a shaky period beforehand. Taking a wider view, although not as strong as the last month, the full year gain of 18% is also fairly reasonable.
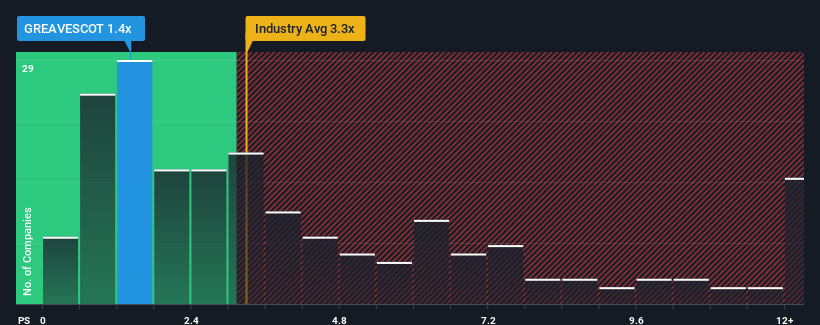
Although its price has surged higher, Greaves Cotton's price-to-sales (or "P/S") ratio of 1.4x might still make it look like a buy right now compared to the Machinery industry in India, where around half of the companies have P/S ratios above 3.3x and even P/S above 7x are quite common. Although, it's not wise to just take the P/S at face value as there may be an explanation why it's limited.
Check out our latest analysis for Greaves Cotton
How Has Greaves Cotton Performed Recently?
Greaves Cotton hasn't been tracking well recently as its declining revenue compares poorly to other companies, which have seen some growth in their revenues on average. The P/S ratio is probably low because investors think this poor revenue performance isn't going to get any better. If you still like the company, you'd be hoping this isn't the case so that you could potentially pick up some stock while it's out of favour.
Keen to find out how analysts think Greaves Cotton's future stacks up against the industry? In that case, our free report is a great place to start.How Is Greaves Cotton's Revenue Growth Trending?
In order to justify its P/S ratio, Greaves Cotton would need to produce sluggish growth that's trailing the industry.
Taking a look back first, the company's revenue growth last year wasn't something to get excited about as it posted a disappointing decline of 2.5%. Still, the latest three year period has seen an excellent 75% overall rise in revenue, in spite of its unsatisfying short-term performance. Although it's been a bumpy ride, it's still fair to say the revenue growth recently has been more than adequate for the company.
Turning to the outlook, the next year should generate growth of 14% as estimated by the lone analyst watching the company. Meanwhile, the rest of the industry is forecast to expand by 13%, which is not materially different.
With this information, we find it odd that Greaves Cotton is trading at a P/S lower than the industry. It may be that most investors are not convinced the company can achieve future growth expectations.
The Final Word
The latest share price surge wasn't enough to lift Greaves Cotton's P/S close to the industry median. It's argued the price-to-sales ratio is an inferior measure of value within certain industries, but it can be a powerful business sentiment indicator.
We've seen that Greaves Cotton currently trades on a lower than expected P/S since its forecast growth is in line with the wider industry. The low P/S could be an indication that the revenue growth estimates are being questioned by the market. Perhaps investors are concerned that the company could underperform against the forecasts over the near term.
And what about other risks? Every company has them, and we've spotted 3 warning signs for Greaves Cotton (of which 2 are concerning!) you should know about.
Of course, profitable companies with a history of great earnings growth are generally safer bets. So you may wish to see this free collection of other companies that have reasonable P/E ratios and have grown earnings strongly.
New: Manage All Your Stock Portfolios in One Place
We've created the ultimate portfolio companion for stock investors, and it's free.
• Connect an unlimited number of Portfolios and see your total in one currency
• Be alerted to new Warning Signs or Risks via email or mobile
• Track the Fair Value of your stocks
Have feedback on this article? Concerned about the content? Get in touch with us directly. Alternatively, email editorial-team (at) simplywallst.com.
This article by Simply Wall St is general in nature. We provide commentary based on historical data and analyst forecasts only using an unbiased methodology and our articles are not intended to be financial advice. It does not constitute a recommendation to buy or sell any stock, and does not take account of your objectives, or your financial situation. We aim to bring you long-term focused analysis driven by fundamental data. Note that our analysis may not factor in the latest price-sensitive company announcements or qualitative material. Simply Wall St has no position in any stocks mentioned.
Have feedback on this article? Concerned about the content? Get in touch with us directly. Alternatively, email editorial-team@simplywallst.com
About NSEI:GREAVESCOT
Greaves Cotton
Operates engineering and mobility retail business in India, Middle East, Africa, Southeast Asia, and internationally.
Adequate balance sheet slight.
Similar Companies
Market Insights

Community Narratives

