- India
- /
- Industrials
- /
- NSEI:GODREJIND
Returns On Capital Signal Tricky Times Ahead For Godrej Industries (NSE:GODREJIND)


There are a few key trends to look for if we want to identify the next multi-bagger. Firstly, we'd want to identify a growing return on capital employed (ROCE) and then alongside that, an ever-increasing base of capital employed. Basically this means that a company has profitable initiatives that it can continue to reinvest in, which is a trait of a compounding machine. However, after briefly looking over the numbers, we don't think Godrej Industries (NSE:GODREJIND) has the makings of a multi-bagger going forward, but let's have a look at why that may be.
What is Return On Capital Employed (ROCE)?
Just to clarify if you're unsure, ROCE is a metric for evaluating how much pre-tax income (in percentage terms) a company earns on the capital invested in its business. To calculate this metric for Godrej Industries, this is the formula:
Return on Capital Employed = Earnings Before Interest and Tax (EBIT) ÷ (Total Assets - Current Liabilities)
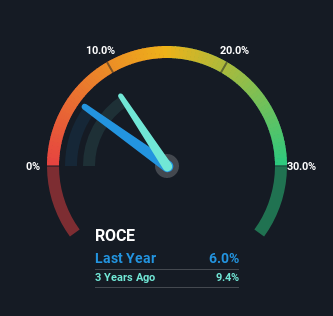
0.06 = ₹10b ÷ (₹312b - ₹138b) (Based on the trailing twelve months to December 2021).
Therefore, Godrej Industries has an ROCE of 6.0%. Ultimately, that's a low return and it under-performs the Industrials industry average of 9.7%.
View our latest analysis for Godrej Industries
While the past is not representative of the future, it can be helpful to know how a company has performed historically, which is why we have this chart above. If you want to delve into the historical earnings, revenue and cash flow of Godrej Industries, check out these free graphs here.
The Trend Of ROCE
In terms of Godrej Industries' historical ROCE movements, the trend isn't fantastic. Over the last five years, returns on capital have decreased to 6.0% from 13% five years ago. However, given capital employed and revenue have both increased it appears that the business is currently pursuing growth, at the consequence of short term returns. If these investments prove successful, this can bode very well for long term stock performance.
On a side note, Godrej Industries has done well to pay down its current liabilities to 44% of total assets. That could partly explain why the ROCE has dropped. Effectively this means their suppliers or short-term creditors are funding less of the business, which reduces some elements of risk. Some would claim this reduces the business' efficiency at generating ROCE since it is now funding more of the operations with its own money. Keep in mind 44% is still pretty high, so those risks are still somewhat prevalent.
What We Can Learn From Godrej Industries' ROCE
In summary, despite lower returns in the short term, we're encouraged to see that Godrej Industries is reinvesting for growth and has higher sales as a result. These growth trends haven't led to growth returns though, since the stock has fallen 20% over the last five years. So we think it'd be worthwhile to look further into this stock given the trends look encouraging.
One more thing, we've spotted 1 warning sign facing Godrej Industries that you might find interesting.
While Godrej Industries isn't earning the highest return, check out this free list of companies that are earning high returns on equity with solid balance sheets.
New: Manage All Your Stock Portfolios in One Place
We've created the ultimate portfolio companion for stock investors, and it's free.
• Connect an unlimited number of Portfolios and see your total in one currency
• Be alerted to new Warning Signs or Risks via email or mobile
• Track the Fair Value of your stocks
Have feedback on this article? Concerned about the content? Get in touch with us directly. Alternatively, email editorial-team (at) simplywallst.com.
This article by Simply Wall St is general in nature. We provide commentary based on historical data and analyst forecasts only using an unbiased methodology and our articles are not intended to be financial advice. It does not constitute a recommendation to buy or sell any stock, and does not take account of your objectives, or your financial situation. We aim to bring you long-term focused analysis driven by fundamental data. Note that our analysis may not factor in the latest price-sensitive company announcements or qualitative material. Simply Wall St has no position in any stocks mentioned.
About NSEI:GODREJIND
Godrej Industries
Engages in the chemical, consumer goods, real estate, agriculture, and financial services businesses in India and Internationally.
Low with imperfect balance sheet.
Similar Companies
Market Insights

Community Narratives


