
Advertisement
- India
- /
- Industrials
- /
- NSEI:GODREJIND
Godrej Industries (NSE:GODREJIND) Has More To Do To Multiply In Value Going Forward
To find a multi-bagger stock, what are the underlying trends we should look for in a business? Firstly, we'll want to see a proven return on capital employed (ROCE) that is increasing, and secondly, an expanding base of capital employed. This shows us that it's a compounding machine, able to continually reinvest its earnings back into the business and generate higher returns. However, after investigating Godrej Industries (NSE:GODREJIND), we don't think it's current trends fit the mold of a multi-bagger.
Understanding Return On Capital Employed (ROCE)
For those that aren't sure what ROCE is, it measures the amount of pre-tax profits a company can generate from the capital employed in its business. To calculate this metric for Godrej Industries, this is the formula:
Return on Capital Employed = Earnings Before Interest and Tax (EBIT) ÷ (Total Assets - Current Liabilities)
0.095 = ₹26b ÷ (₹615b - ₹344b) (Based on the trailing twelve months to June 2024).
So, Godrej Industries has an ROCE of 9.5%. In absolute terms, that's a low return and it also under-performs the Industrials industry average of 13%.
See our latest analysis for Godrej Industries
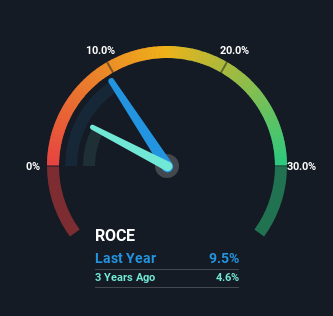
Historical performance is a great place to start when researching a stock so above you can see the gauge for Godrej Industries' ROCE against it's prior returns. If you're interested in investigating Godrej Industries' past further, check out this free graph covering Godrej Industries' past earnings, revenue and cash flow.
What Can We Tell From Godrej Industries' ROCE Trend?
The returns on capital haven't changed much for Godrej Industries in recent years. The company has employed 236% more capital in the last five years, and the returns on that capital have remained stable at 9.5%. This poor ROCE doesn't inspire confidence right now, and with the increase in capital employed, it's evident that the business isn't deploying the funds into high return investments.
On a side note, Godrej Industries' current liabilities are still rather high at 56% of total assets. This can bring about some risks because the company is basically operating with a rather large reliance on its suppliers or other sorts of short-term creditors. Ideally we'd like to see this reduce as that would mean fewer obligations bearing risks.
In Conclusion...
In summary, Godrej Industries has simply been reinvesting capital and generating the same low rate of return as before. Investors must think there's better things to come because the stock has knocked it out of the park, delivering a 148% gain to shareholders who have held over the last five years. However, unless these underlying trends turn more positive, we wouldn't get our hopes up too high.
On a final note, we found 3 warning signs for Godrej Industries (1 is a bit unpleasant) you should be aware of.
While Godrej Industries may not currently earn the highest returns, we've compiled a list of companies that currently earn more than 25% return on equity. Check out this free list here.
New: Manage All Your Stock Portfolios in One Place
We've created the ultimate portfolio companion for stock investors, and it's free.
• Connect an unlimited number of Portfolios and see your total in one currency
• Be alerted to new Warning Signs or Risks via email or mobile
• Track the Fair Value of your stocks
Have feedback on this article? Concerned about the content? Get in touch with us directly. Alternatively, email editorial-team (at) simplywallst.com.
This article by Simply Wall St is general in nature. We provide commentary based on historical data and analyst forecasts only using an unbiased methodology and our articles are not intended to be financial advice. It does not constitute a recommendation to buy or sell any stock, and does not take account of your objectives, or your financial situation. We aim to bring you long-term focused analysis driven by fundamental data. Note that our analysis may not factor in the latest price-sensitive company announcements or qualitative material. Simply Wall St has no position in any stocks mentioned.
About NSEI:GODREJIND
Godrej Industries
Engages in the chemical, agriculture, real estate, vegetable oil, hospitality, and financial and investment businesses in India and internationally.
Proven track record with imperfect balance sheet.
Similar Companies
Market Insights

Advertisement
Community Narratives
Quality at a Premium. A time to watch, not to buy?
Fair Value US$154.56|29.9% undervalued
DA
Community Contributor
GRAB: The Super-App at the Heart of Southeast Asia’s Digital Boom
Fair Value US$8.20|22.9% undervalued
BL
Community Contributor
Verve Group to Surge with 51.61% Revenue Growth
Fair Value €6.00|64.1% undervalued
ME
Community Contributor