Cochin Shipyard (NSE:COCHINSHIP) Has Some Way To Go To Become A Multi-Bagger


Finding a business that has the potential to grow substantially is not easy, but it is possible if we look at a few key financial metrics. One common approach is to try and find a company with returns on capital employed (ROCE) that are increasing, in conjunction with a growing amount of capital employed. This shows us that it's a compounding machine, able to continually reinvest its earnings back into the business and generate higher returns. So, when we ran our eye over Cochin Shipyard's (NSE:COCHINSHIP) trend of ROCE, we liked what we saw.
What Is Return On Capital Employed (ROCE)?
For those who don't know, ROCE is a measure of a company's yearly pre-tax profit (its return), relative to the capital employed in the business. The formula for this calculation on Cochin Shipyard is:
Return on Capital Employed = Earnings Before Interest and Tax (EBIT) ÷ (Total Assets - Current Liabilities)
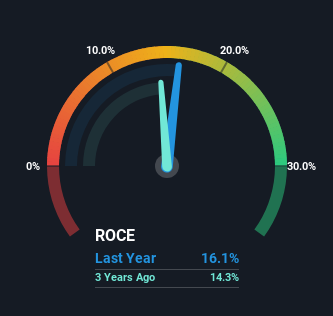
0.16 = ₹8.9b ÷ (₹121b - ₹65b) (Based on the trailing twelve months to June 2024).
So, Cochin Shipyard has an ROCE of 16%. That's a relatively normal return on capital, and it's around the 17% generated by the Machinery industry.
View our latest analysis for Cochin Shipyard
Above you can see how the current ROCE for Cochin Shipyard compares to its prior returns on capital, but there's only so much you can tell from the past. If you'd like to see what analysts are forecasting going forward, you should check out our free analyst report for Cochin Shipyard .
What Does the ROCE Trend For Cochin Shipyard Tell Us?
While the current returns on capital are decent, they haven't changed much. The company has employed 59% more capital in the last five years, and the returns on that capital have remained stable at 16%. 16% is a pretty standard return, and it provides some comfort knowing that Cochin Shipyard has consistently earned this amount. Over long periods of time, returns like these might not be too exciting, but with consistency they can pay off in terms of share price returns.
On another note, while the change in ROCE trend might not scream for attention, it's interesting that the current liabilities have actually gone up over the last five years. This is intriguing because if current liabilities hadn't increased to 54% of total assets, this reported ROCE would probably be less than16% because total capital employed would be higher.The 16% ROCE could be even lower if current liabilities weren't 54% of total assets, because the the formula would show a larger base of total capital employed. So with current liabilities at such high levels, this effectively means the likes of suppliers or short-term creditors are funding a meaningful part of the business, which in some instances can bring some risks.
The Key Takeaway
The main thing to remember is that Cochin Shipyard has proven its ability to continually reinvest at respectable rates of return. And the stock has done incredibly well with a 1,321% return over the last five years, so long term investors are no doubt ecstatic with that result. So while investors seem to be recognizing these promising trends, we still believe the stock deserves further research.
One more thing, we've spotted 2 warning signs facing Cochin Shipyard that you might find interesting.
If you want to search for solid companies with great earnings, check out this free list of companies with good balance sheets and impressive returns on equity.
If you're looking to trade Cochin Shipyard, open an account with the lowest-cost platform trusted by professionals, Interactive Brokers.
With clients in over 200 countries and territories, and access to 160 markets, IBKR lets you trade stocks, options, futures, forex, bonds and funds from a single integrated account.
Enjoy no hidden fees, no account minimums, and FX conversion rates as low as 0.03%, far better than what most brokers offer.
Sponsored ContentNew: AI Stock Screener & Alerts
Our new AI Stock Screener scans the market every day to uncover opportunities.
• Dividend Powerhouses (3%+ Yield)
• Undervalued Small Caps with Insider Buying
• High growth Tech and AI Companies
Or build your own from over 50 metrics.
Have feedback on this article? Concerned about the content? Get in touch with us directly. Alternatively, email editorial-team (at) simplywallst.com.
This article by Simply Wall St is general in nature. We provide commentary based on historical data and analyst forecasts only using an unbiased methodology and our articles are not intended to be financial advice. It does not constitute a recommendation to buy or sell any stock, and does not take account of your objectives, or your financial situation. We aim to bring you long-term focused analysis driven by fundamental data. Note that our analysis may not factor in the latest price-sensitive company announcements or qualitative material. Simply Wall St has no position in any stocks mentioned.
About NSEI:COCHINSHIP
Cochin Shipyard
Engages in the shipbuilding and repair of ships/offshore structures in India.
Solid track record with adequate balance sheet.
Similar Companies
Market Insights

Community Narratives

