
Advertisement
Blue Star (NSE:BLUESTARCO) Seems To Use Debt Quite Sensibly
The external fund manager backed by Berkshire Hathaway's Charlie Munger, Li Lu, makes no bones about it when he says 'The biggest investment risk is not the volatility of prices, but whether you will suffer a permanent loss of capital.' When we think about how risky a company is, we always like to look at its use of debt, since debt overload can lead to ruin. As with many other companies Blue Star Limited (NSE:BLUESTARCO) makes use of debt. But the more important question is: how much risk is that debt creating?
When Is Debt A Problem?
Debt assists a business until the business has trouble paying it off, either with new capital or with free cash flow. Ultimately, if the company can't fulfill its legal obligations to repay debt, shareholders could walk away with nothing. While that is not too common, we often do see indebted companies permanently diluting shareholders because lenders force them to raise capital at a distressed price. Of course, plenty of companies use debt to fund growth, without any negative consequences. The first thing to do when considering how much debt a business uses is to look at its cash and debt together.
What Is Blue Star's Net Debt?
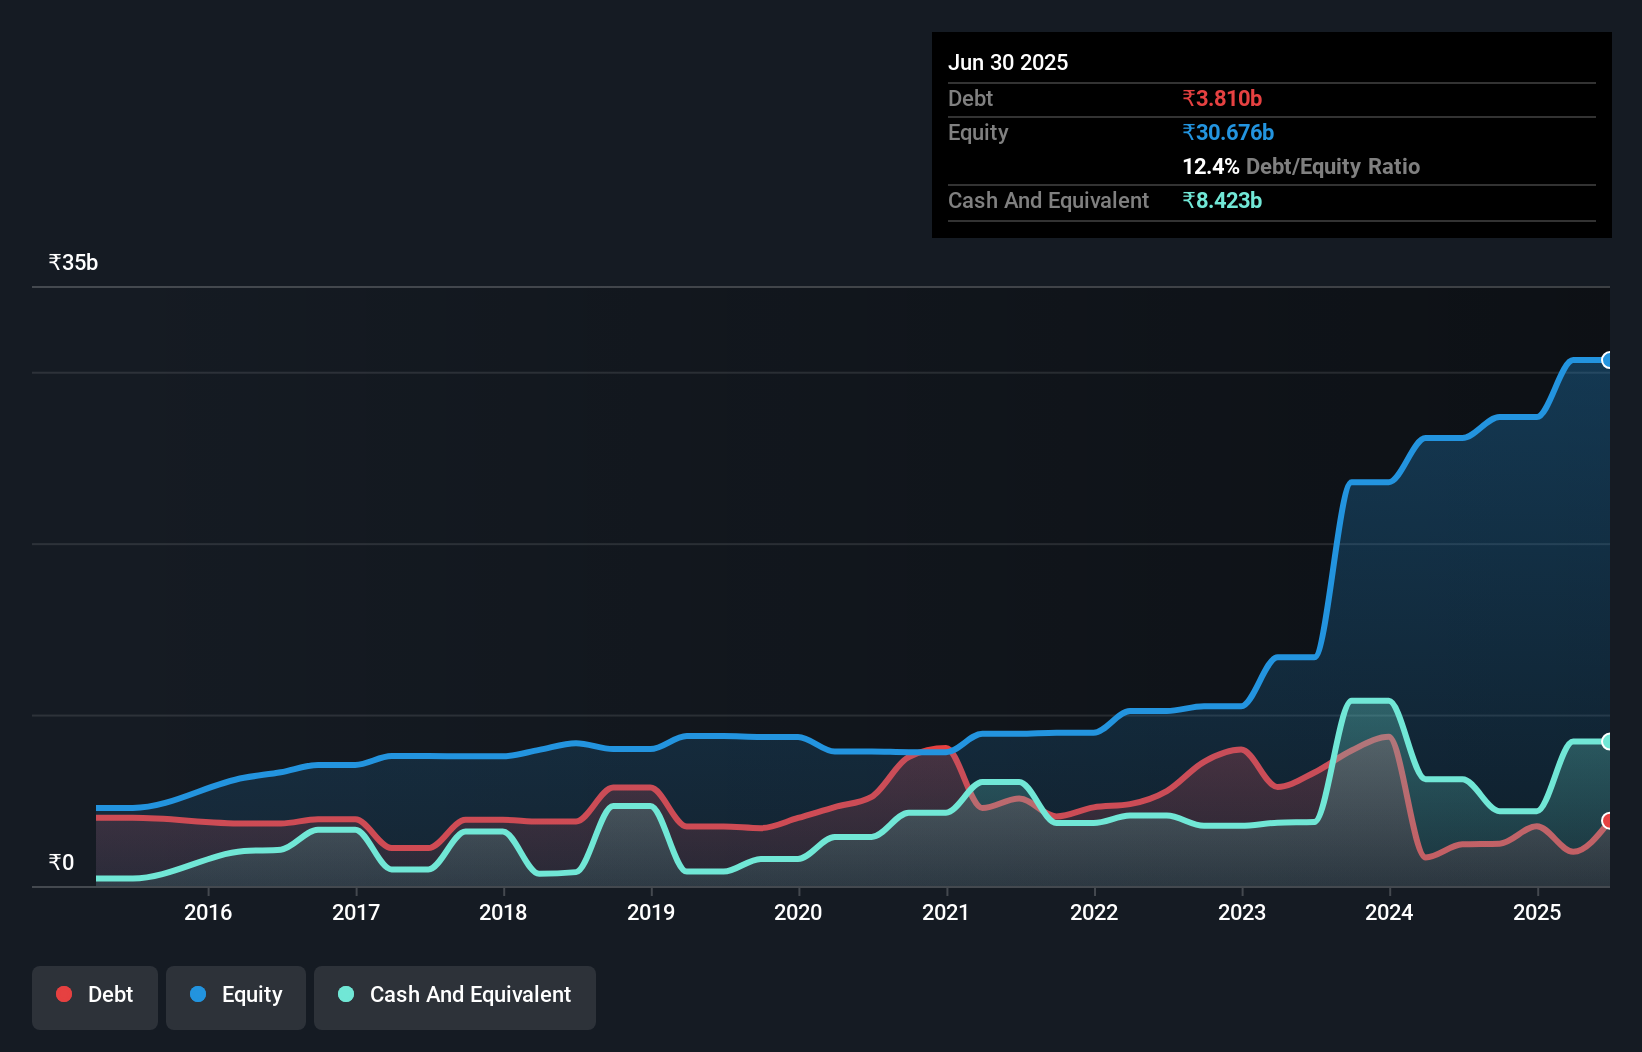
The image below, which you can click on for greater detail, shows that at March 2025 Blue Star had debt of ₹3.81b, up from ₹2.43b in one year. However, its balance sheet shows it holds ₹8.42b in cash, so it actually has ₹4.61b net cash.
How Strong Is Blue Star's Balance Sheet?
Zooming in on the latest balance sheet data, we can see that Blue Star had liabilities of ₹49.4b due within 12 months and liabilities of ₹2.45b due beyond that. Offsetting these obligations, it had cash of ₹8.42b as well as receivables valued at ₹29.5b due within 12 months. So its liabilities outweigh the sum of its cash and (near-term) receivables by ₹14.0b.
Given Blue Star has a market capitalization of ₹395.6b, it's hard to believe these liabilities pose much threat. But there are sufficient liabilities that we would certainly recommend shareholders continue to monitor the balance sheet, going forward. While it does have liabilities worth noting, Blue Star also has more cash than debt, so we're pretty confident it can manage its debt safely.
Check out our latest analysis for Blue Star
Fortunately, Blue Star grew its EBIT by 5.0% in the last year, making that debt load look even more manageable. There's no doubt that we learn most about debt from the balance sheet. But it is future earnings, more than anything, that will determine Blue Star's ability to maintain a healthy balance sheet going forward. So if you're focused on the future you can check out this free report showing analyst profit forecasts.
Finally, while the tax-man may adore accounting profits, lenders only accept cold hard cash. While Blue Star has net cash on its balance sheet, it's still worth taking a look at its ability to convert earnings before interest and tax (EBIT) to free cash flow, to help us understand how quickly it is building (or eroding) that cash balance. Over the last three years, Blue Star reported free cash flow worth 4.1% of its EBIT, which is really quite low. For us, cash conversion that low sparks a little paranoia about is ability to extinguish debt.
Summing Up
While it is always sensible to look at a company's total liabilities, it is very reassuring that Blue Star has ₹4.61b in net cash. On top of that, it increased its EBIT by 5.0% in the last twelve months. So we don't have any problem with Blue Star's use of debt. When analysing debt levels, the balance sheet is the obvious place to start. But ultimately, every company can contain risks that exist outside of the balance sheet. Case in point: We've spotted 1 warning sign for Blue Star you should be aware of.
At the end of the day, it's often better to focus on companies that are free from net debt. You can access our special list of such companies (all with a track record of profit growth). It's free.
Valuation is complex, but we're here to simplify it.
Discover if Blue Star might be undervalued or overvalued with our detailed analysis, featuring fair value estimates, potential risks, dividends, insider trades, and its financial condition.
Access Free AnalysisHave feedback on this article? Concerned about the content? Get in touch with us directly. Alternatively, email editorial-team (at) simplywallst.com.
This article by Simply Wall St is general in nature. We provide commentary based on historical data and analyst forecasts only using an unbiased methodology and our articles are not intended to be financial advice. It does not constitute a recommendation to buy or sell any stock, and does not take account of your objectives, or your financial situation. We aim to bring you long-term focused analysis driven by fundamental data. Note that our analysis may not factor in the latest price-sensitive company announcements or qualitative material. Simply Wall St has no position in any stocks mentioned.
About NSEI:BLUESTARCO
Blue Star
Operates as a heating, ventilation, air conditioning, and commercial refrigeration (HVAC&R) company in India.
Flawless balance sheet with high growth potential and pays a dividend.
Similar Companies
Market Insights

Advertisement
Community Narratives
Quality at a Premium. A time to watch, not to buy?
Fair Value US$154.56|29.9% undervalued
DA
Community Contributor
GRAB: The Super-App at the Heart of Southeast Asia’s Digital Boom
Fair Value US$8.20|22.9% undervalued
BL
Community Contributor
Verve Group to Surge with 51.61% Revenue Growth
Fair Value €6.00|64.1% undervalued
ME
Community Contributor